
SOUTHEAST ECONOMIC ADVISORS
Regional Economic Report | September 2026
The South Is Adding Residents Faster Than Income
Southern states grew 1.7% over the past year, slower than the 2.4% in the rest of the nation, but their populations grew about ten times as fast, and Southern consumers spent 5.7% more in 2025 than in 2024.
At a Glance
- Southern real GDP grew 1.7% over the past year, against 2.4% in the rest of the nation, and 2.1% against 2.3% in the second quarter.
- The South added residents at a 0.6% pace against 0.1% elsewhere, so income per person rose 3.6% against 4.4%.
- Nondurable goods output fell in 13 of 15 Southern states with data, and the sector is 5.4% of the South’s real GDP against 4.0% elsewhere.
- Ten of the 12 fastest-growing states trail the nation’s 4.1% income per person growth. Only Idaho and South Dakota beat it.
- Southern consumer spending rose 5.7% in 2025 against 5.1% elsewhere, led by Florida at 7.0%. Tourism explains little of the gap, while housing & utilities supplied 0.39 of the 0.58-point edge.
- We expect the December release to show Southern income per person growing at least 0.5 points more slowly than elsewhere, with population growth still above the nation’s.
The Bureau of Economic Analysis released second-quarter state estimates on Wednesday, and they show the South growing close to the national pace in the spring but slower than the rest of the country over the past year. Real GDP in the 16 states we define as the South (Alabama, Arkansas, Florida, Georgia, Kentucky, Louisiana, Maryland, Mississippi, Missouri, North Carolina, Oklahoma, South Carolina, Tennessee, Texas, Virginia and West Virginia) rose at a 2.1% annual rate in the second quarter, against 2.3% in the other 34 states and the District of Columbia and 2.2% for the nation. Over the year the gap was wider, at 1.7% for the South and 2.4% elsewhere, with Texas (+1.7%), the South’s largest economy, and Maryland (-0.6%) falling short of the nation.
Personal income rose at a 4.7% annual rate in both the South and the rest of the country in the second quarter, and 4.2% over the year against 4.5% elsewhere. The South added residents at a 0.6% pace against 0.1% elsewhere, so income per person rose 3.6% in the South and 4.4% in the rest of the country. State consumer spending is published with a longer lag, and the latest data cover 2025, when spending in the South rose 5.7% against 5.1% elsewhere.
For businesses, lenders and state budget offices the difference between total and per person growth is the practical one. More residents mean more customers, borrowers and taxpayers, and the South is gaining them about ten times as fast as the rest of the country. Income per person determines what each of them can afford to pay for housing, credit or merchandise, and it is rising more slowly (3.6% against 4.4%). Southern markets should therefore keep generating volume, but with less room to raise prices, rents and fees than the headline growth implies. The sections below trace the shortfall to a manufacturing base weighted toward nondurable goods, a port and logistics sector exposed to tariffs and an income mix that leans on transfers in some states and on portfolio income in Florida.
How the Regions Compare
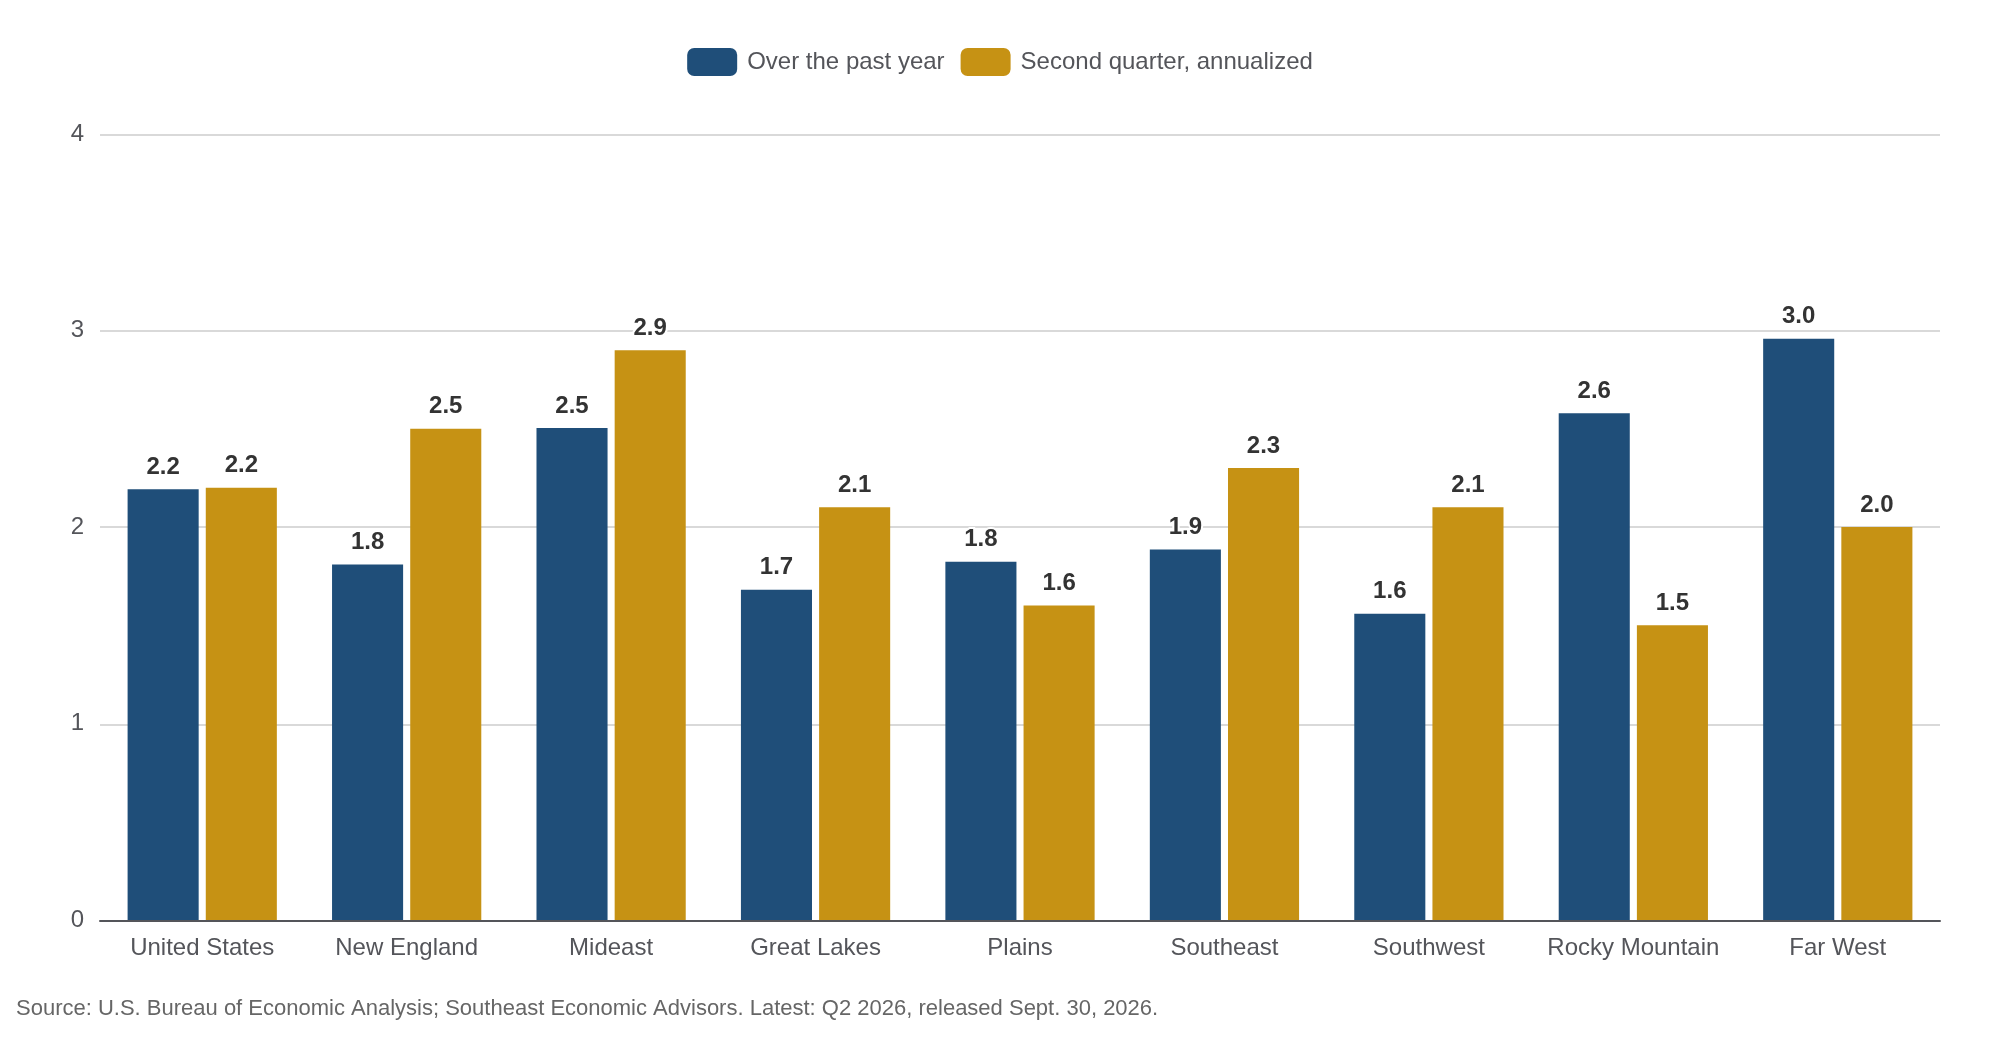
Among BEA’s eight regions, the Far West led over the past year (+3.0%), followed by the Rocky Mountain (+2.6%) and Mideast (+2.5%) regions, with the Southeast (+1.9%) and Southwest (+1.6%) in the bottom half. The spring told a different story. In the second quarter the Mideast (+2.9%) and New England (+2.5%) led, the Southeast (+2.3%) ran ahead of the nation’s 2.2%, the Southwest (+2.1%) nearly matched it, and the Rocky Mountain region (+1.5%) and the Plains (+1.6%) fell to the bottom. The Far West’s lead over the year rests heavily on California (+3.6%), and the Mideast’s on New York (+4.6%), the fastest of any state, and we return below to why the information sector matters for both.
The South State by State
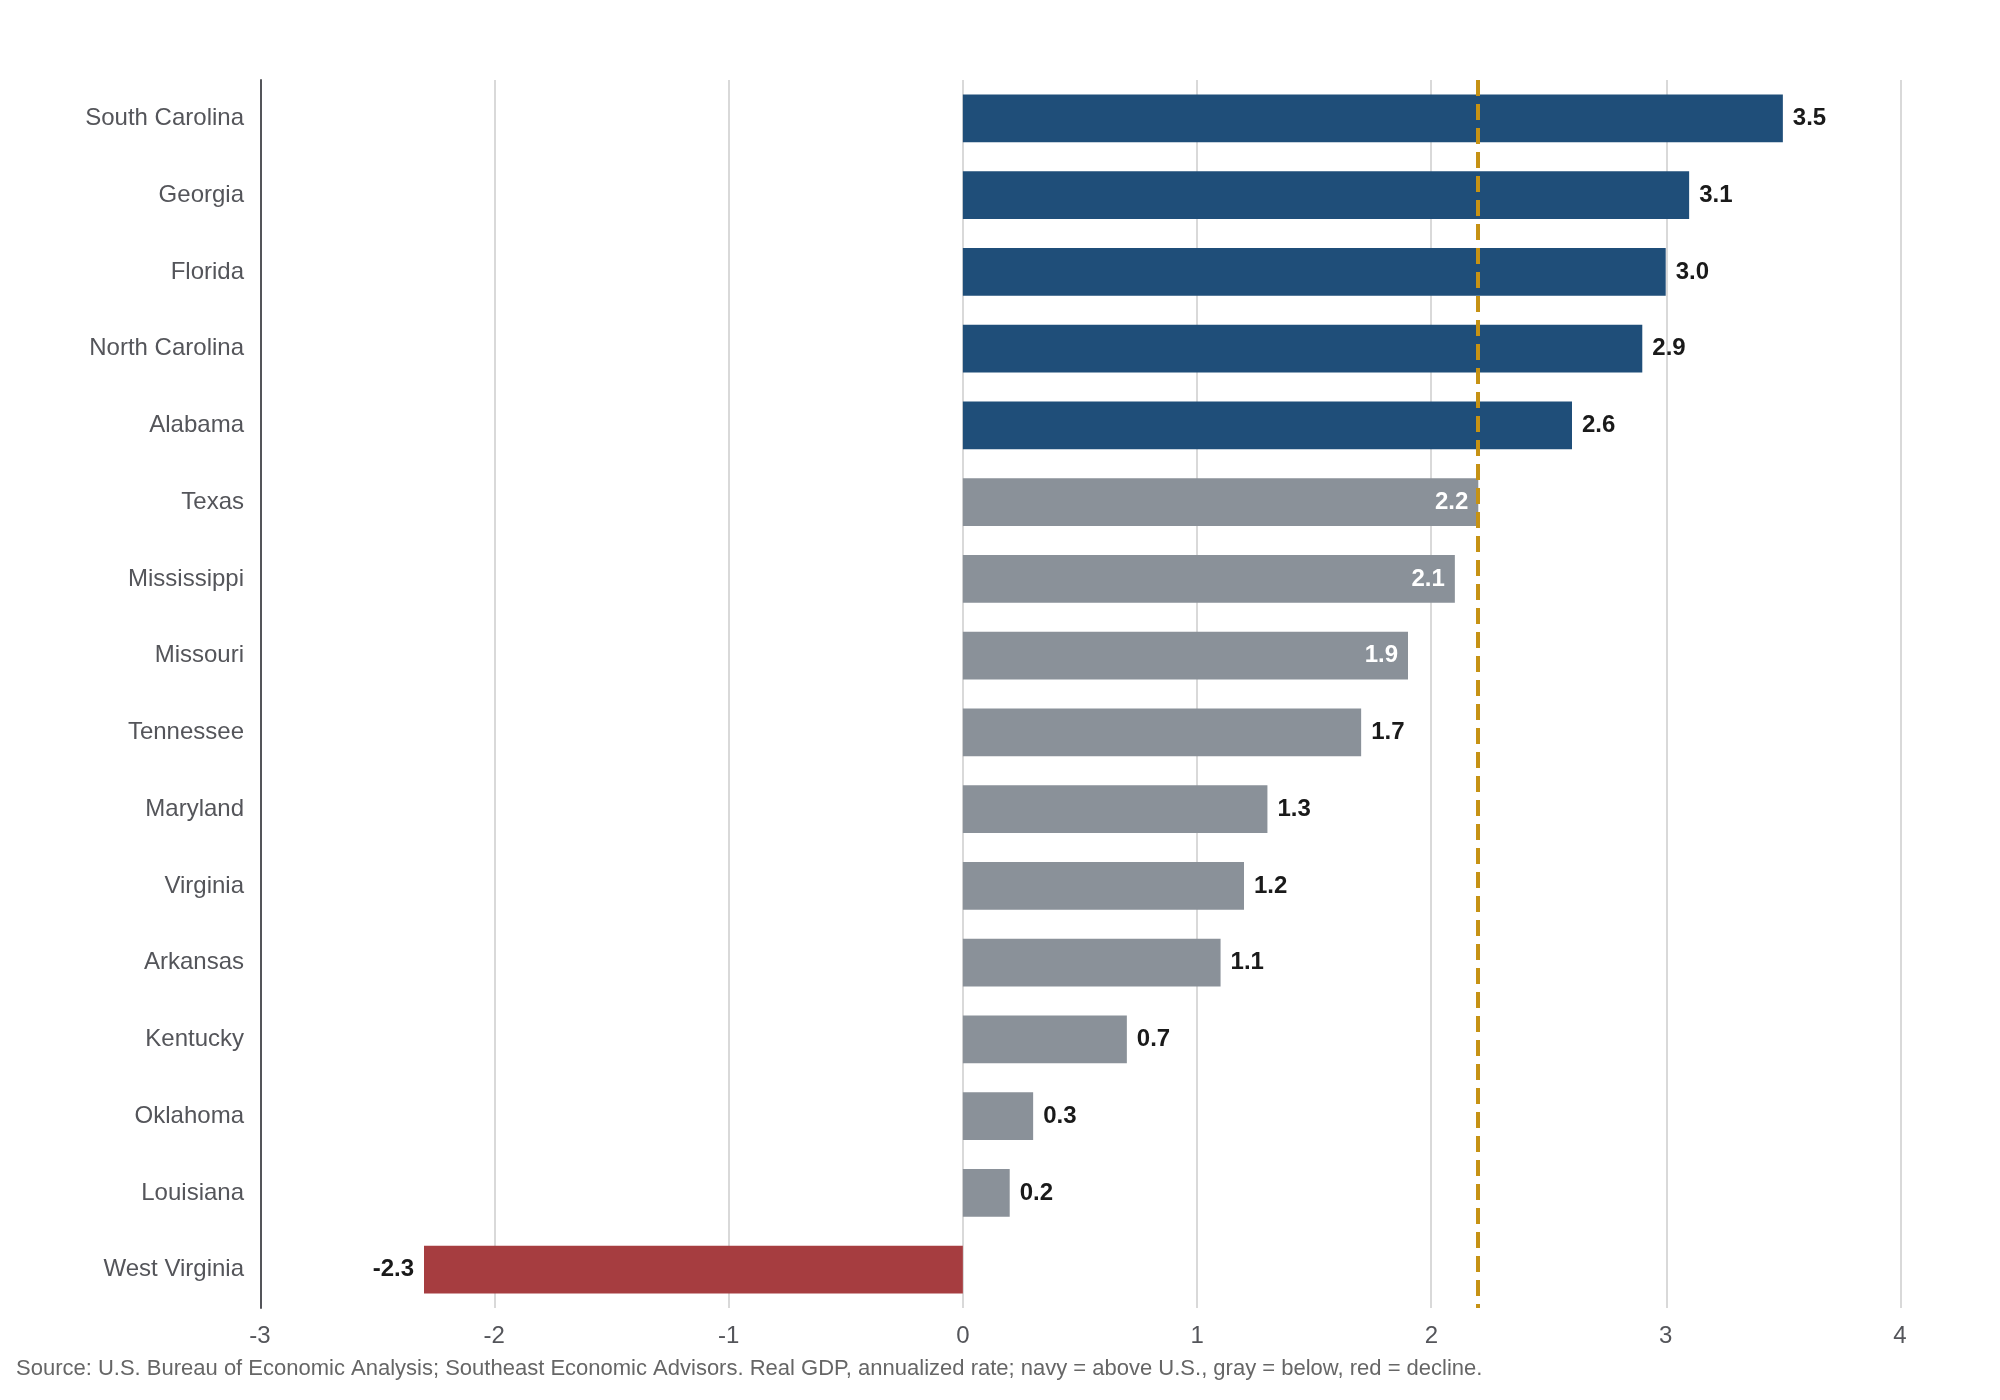
South Carolina (+3.5%), Georgia (+3.1%), Florida (+3.0%), North Carolina (+2.9%) and Alabama (+2.6%) all grew faster than the nation in the second quarter, and Texas (+2.2%) matched it. The four fastest states are all on the Atlantic Coast. At the other end, West Virginia contracted 2.3%, as mining subtracted 3.6 percentage points, and Oklahoma (+0.3%) and Louisiana (+0.2%) barely grew with mining subtractions of 0.6 and 0.5 points. Mississippi (+2.1%), Missouri (+1.9%), Tennessee (+1.7%), Maryland (+1.3%), Virginia (+1.2%), Arkansas (+1.1%) and Kentucky (+0.7%) also finished below the national rate. Quarterly state rates are volatile, however, and over the past year only Florida (+3.0%) and South Carolina (+2.6%) among the Southern states beat the nation’s 2.2%.
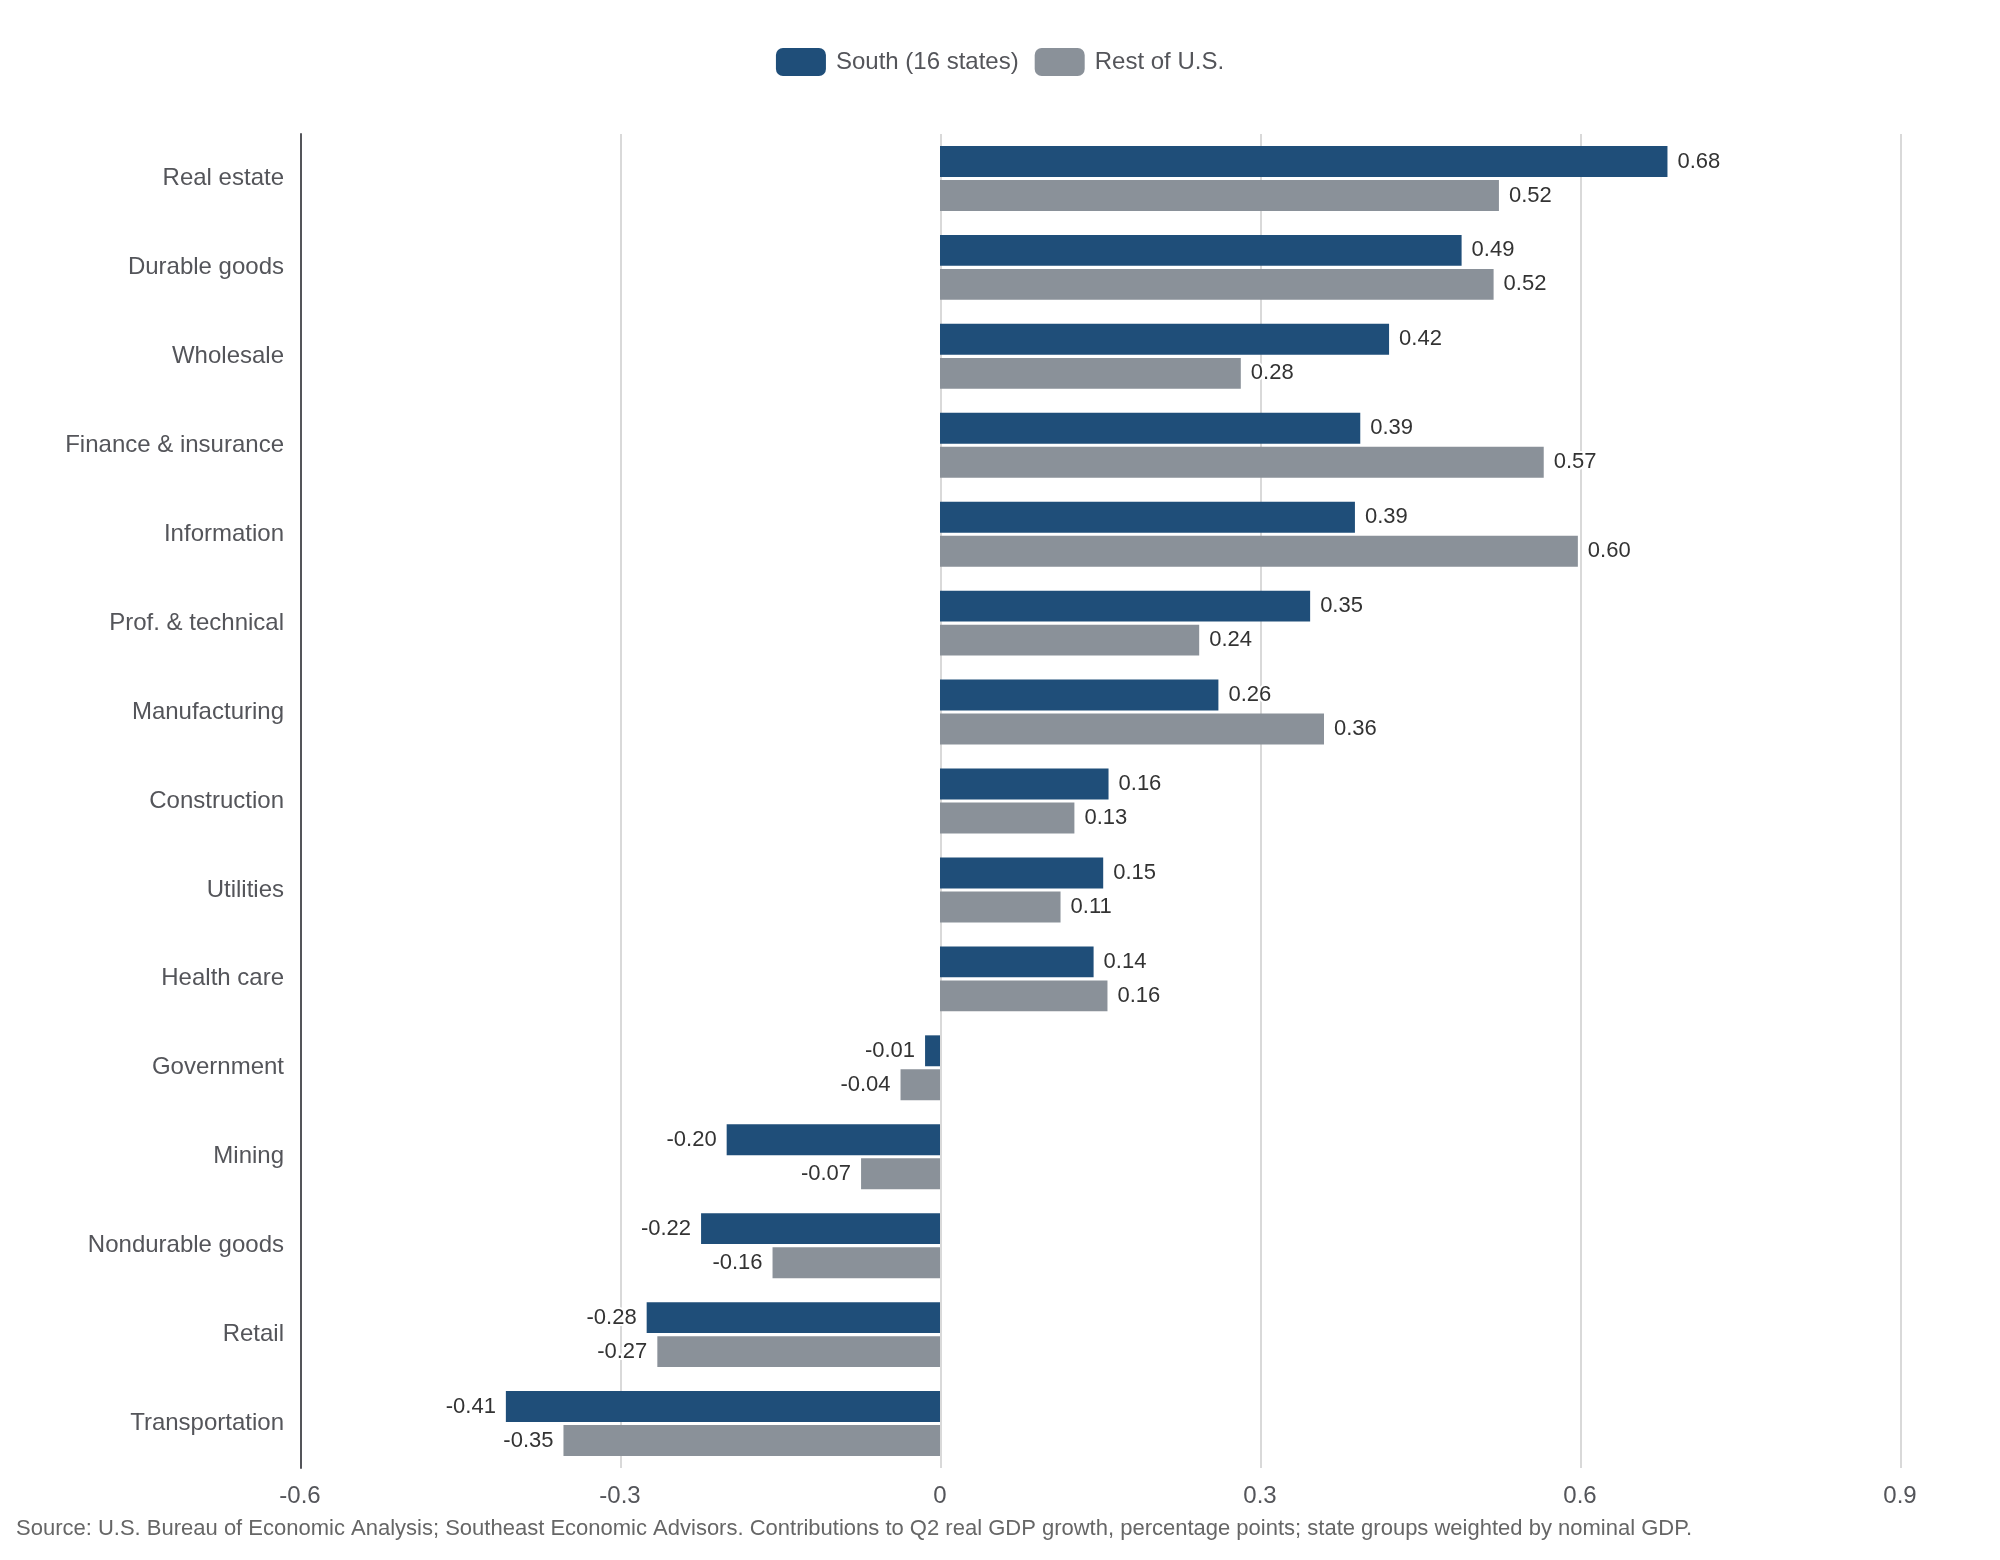
The industry mix explains part of the South’s shortfall. Real estate contributed 0.68 percentage points to second-quarter growth in the South against 0.52 elsewhere, wholesale trade 0.42 against 0.28 and professional & technical services 0.35 against 0.24. Information (0.39 against 0.60), finance & insurance (0.39 against 0.57) and manufacturing (0.26 against 0.36) contributed less, and mining subtracted 0.20 points in the South against 0.07 elsewhere.
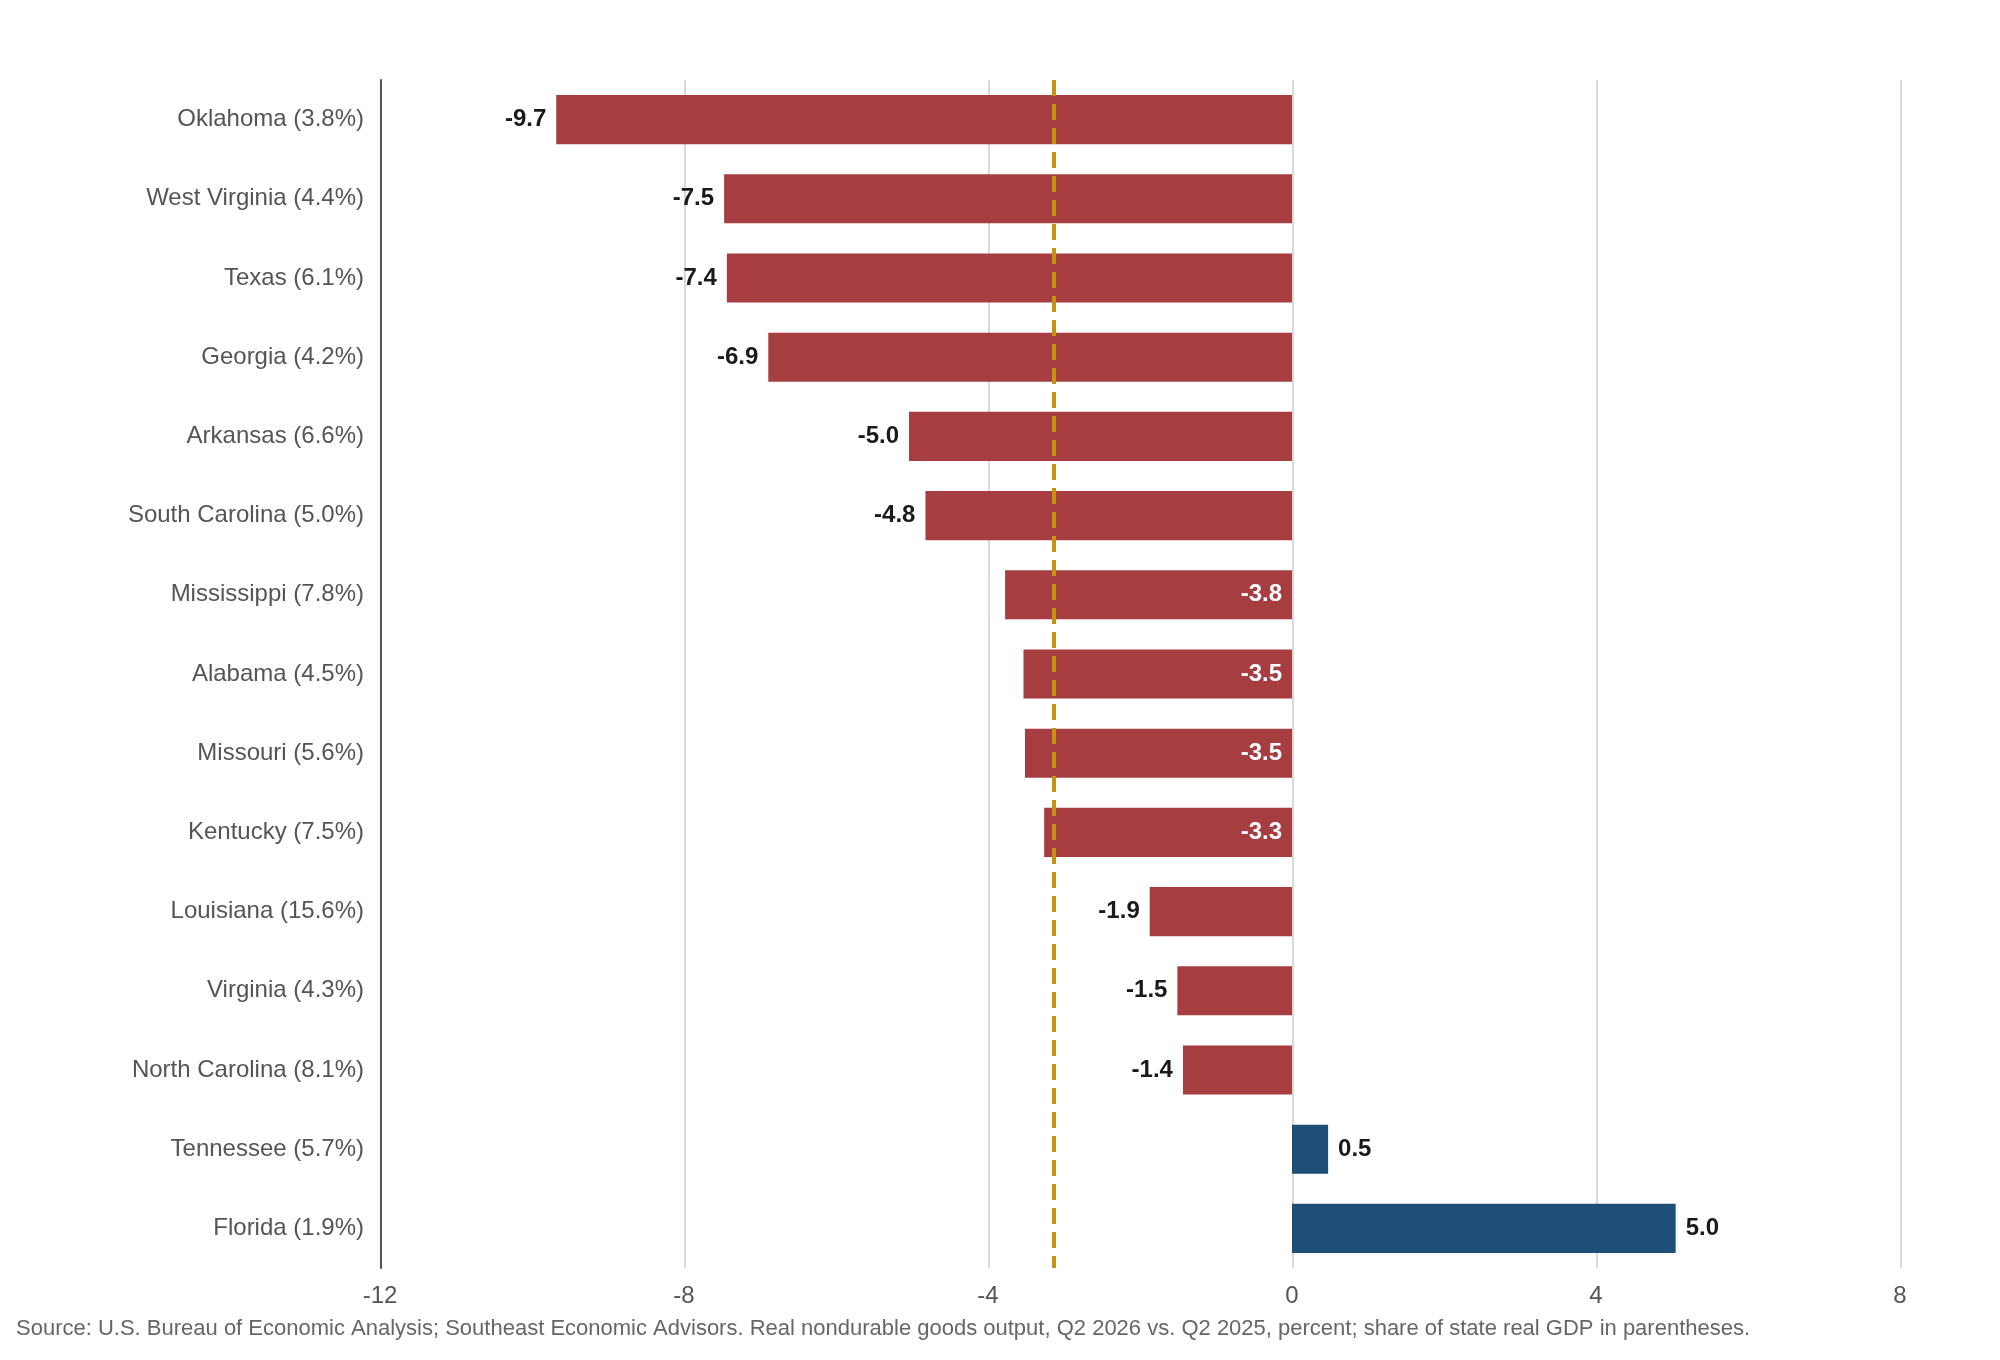
Manufacturing accounts for a good part of the South’s shortfall over the past year, with an average contribution of 0.02 percentage points per quarter against 0.27 elsewhere, a gap exceeded only by information and finance & insurance. The state detail supports the view that the South’s factory base is weighted toward the weaker half of the sector. Nondurable goods (food, chemicals, refined petroleum, paper, textiles and plastics) make up 5.4% of real GDP in the South against 4.0% elsewhere, and much more in several states, including Louisiana (15.6%), North Carolina (8.1%), Mississippi (7.8%), Kentucky (7.5%) and Arkansas (6.6%), against 1.9% in Florida. Real nondurable output fell 3.2% nationally over the past year and fell in 13 of the 15 Southern states with data, led by Oklahoma (-9.7%), West Virginia (-7.5%), Texas (-7.4%), Georgia (-6.9%) and Arkansas (-5.0%). Only Florida (+5.0%) and Tennessee (+0.5%) posted gains. Durable goods, where much of the national improvement has occurred, rose 6.2% nationally, but only 5.0% in the South against 6.9% elsewhere.
The implication is that Southern factory output, and the jobs and freight behind it, depends heavily on food, chemical, petroleum and paper markets that are not growing, while the durable goods expansion tied to data centers, power equipment and reshoring has so far lifted other regions by more. We expect Southern manufacturing to keep lagging the national pace until nondurable output stabilizes or the durable goods plants completed in the past two years reach full production.
Ports and distribution, which matter to Georgia, the Carolinas, Virginia, Texas and Louisiana, show a split picture. Container volumes at South Carolina’s ports fell 8% in July and August from a year earlier, extending a slump that began in July 2025, and national container imports in July were 4.3% below July 2025, with tariffs and trade policy uncertainty among the reasons cited. The slowdown appears in the businesses that move goods. Real transportation & warehousing output fell 4.0% nationally over the past year and declined in Georgia (-2.9%), South Carolina (-4.8%), Texas (-2.2%), Virginia (-3.1%) and North Carolina (-2.8%), and the industry subtracted 0.41 points from second-quarter growth in the South. Wholesale trade, however, has held up, with real output up 9.6% in South Carolina and 6.4% in Georgia, against 3.6% nationally, and an average contribution of 0.26 points per quarter in the South over the past four quarters against 0.23 elsewhere. The series is volatile, swinging from +1.07 points in the fourth quarter of 2025 to -0.51 in the first quarter of 2026 in the South, so it is too early to conclude that distributors have escaped the slowdown. If tariffs keep import volumes depressed into the holiday season, we would expect weaker wholesale output and softer demand for warehouse space to follow.
The Information Sector Is Outsized in a Few Places
Nationally, the information sector supplied 0.57 percentage points of the 2.2% growth over the past four quarters, or 26% of it, although the sector makes up 5.9% of nominal GDP. Weighting each state’s contribution by its share of nominal GDP, California and Washington, which together hold 17% of national GDP, account for 43% of that contribution, and adding New York lifts the share to 60% with 25% of GDP. The South holds 36% of GDP and accounts for 22%. Among Southern states, real value added in the sector rose 18.0% in Virginia, 12.4% in Florida and 11.5% in Georgia over the year, against 10.3% nationally, and Georgia made the largest Southern contribution in the second quarter, 1.1 points of its 3.1% growth.
That concentration reflects where the largest software, internet and cloud companies are headquartered, most notably in the Seattle area and the San Francisco Bay Area (including San Jose). Their activities take place nationwide, however: the services are sold to customers in every state, and the data centers, developers and support staff behind them are spread across the country. State GDP appears to allocate the value added largely to where the firms’ establishments and payrolls are located, so the sector looks outsized in a few places and is hard to quantify at the state level anywhere else. The figures are also volatile, with Washington’s contribution to its own growth swinging from 2.2 percentage points in the third quarter of 2025 to about zero since, and this release does not separate the Bay Area from the rest of California. The South’s smaller information contribution therefore should not be read as a measure of its technology-related activity, since much of that activity, including data center construction and power supply, is recorded in other industries. Southern states hosting data centers should look for the payoff in construction, utilities and electrical equipment output and in local tax receipts, since the information line will not capture it.
Personal Income
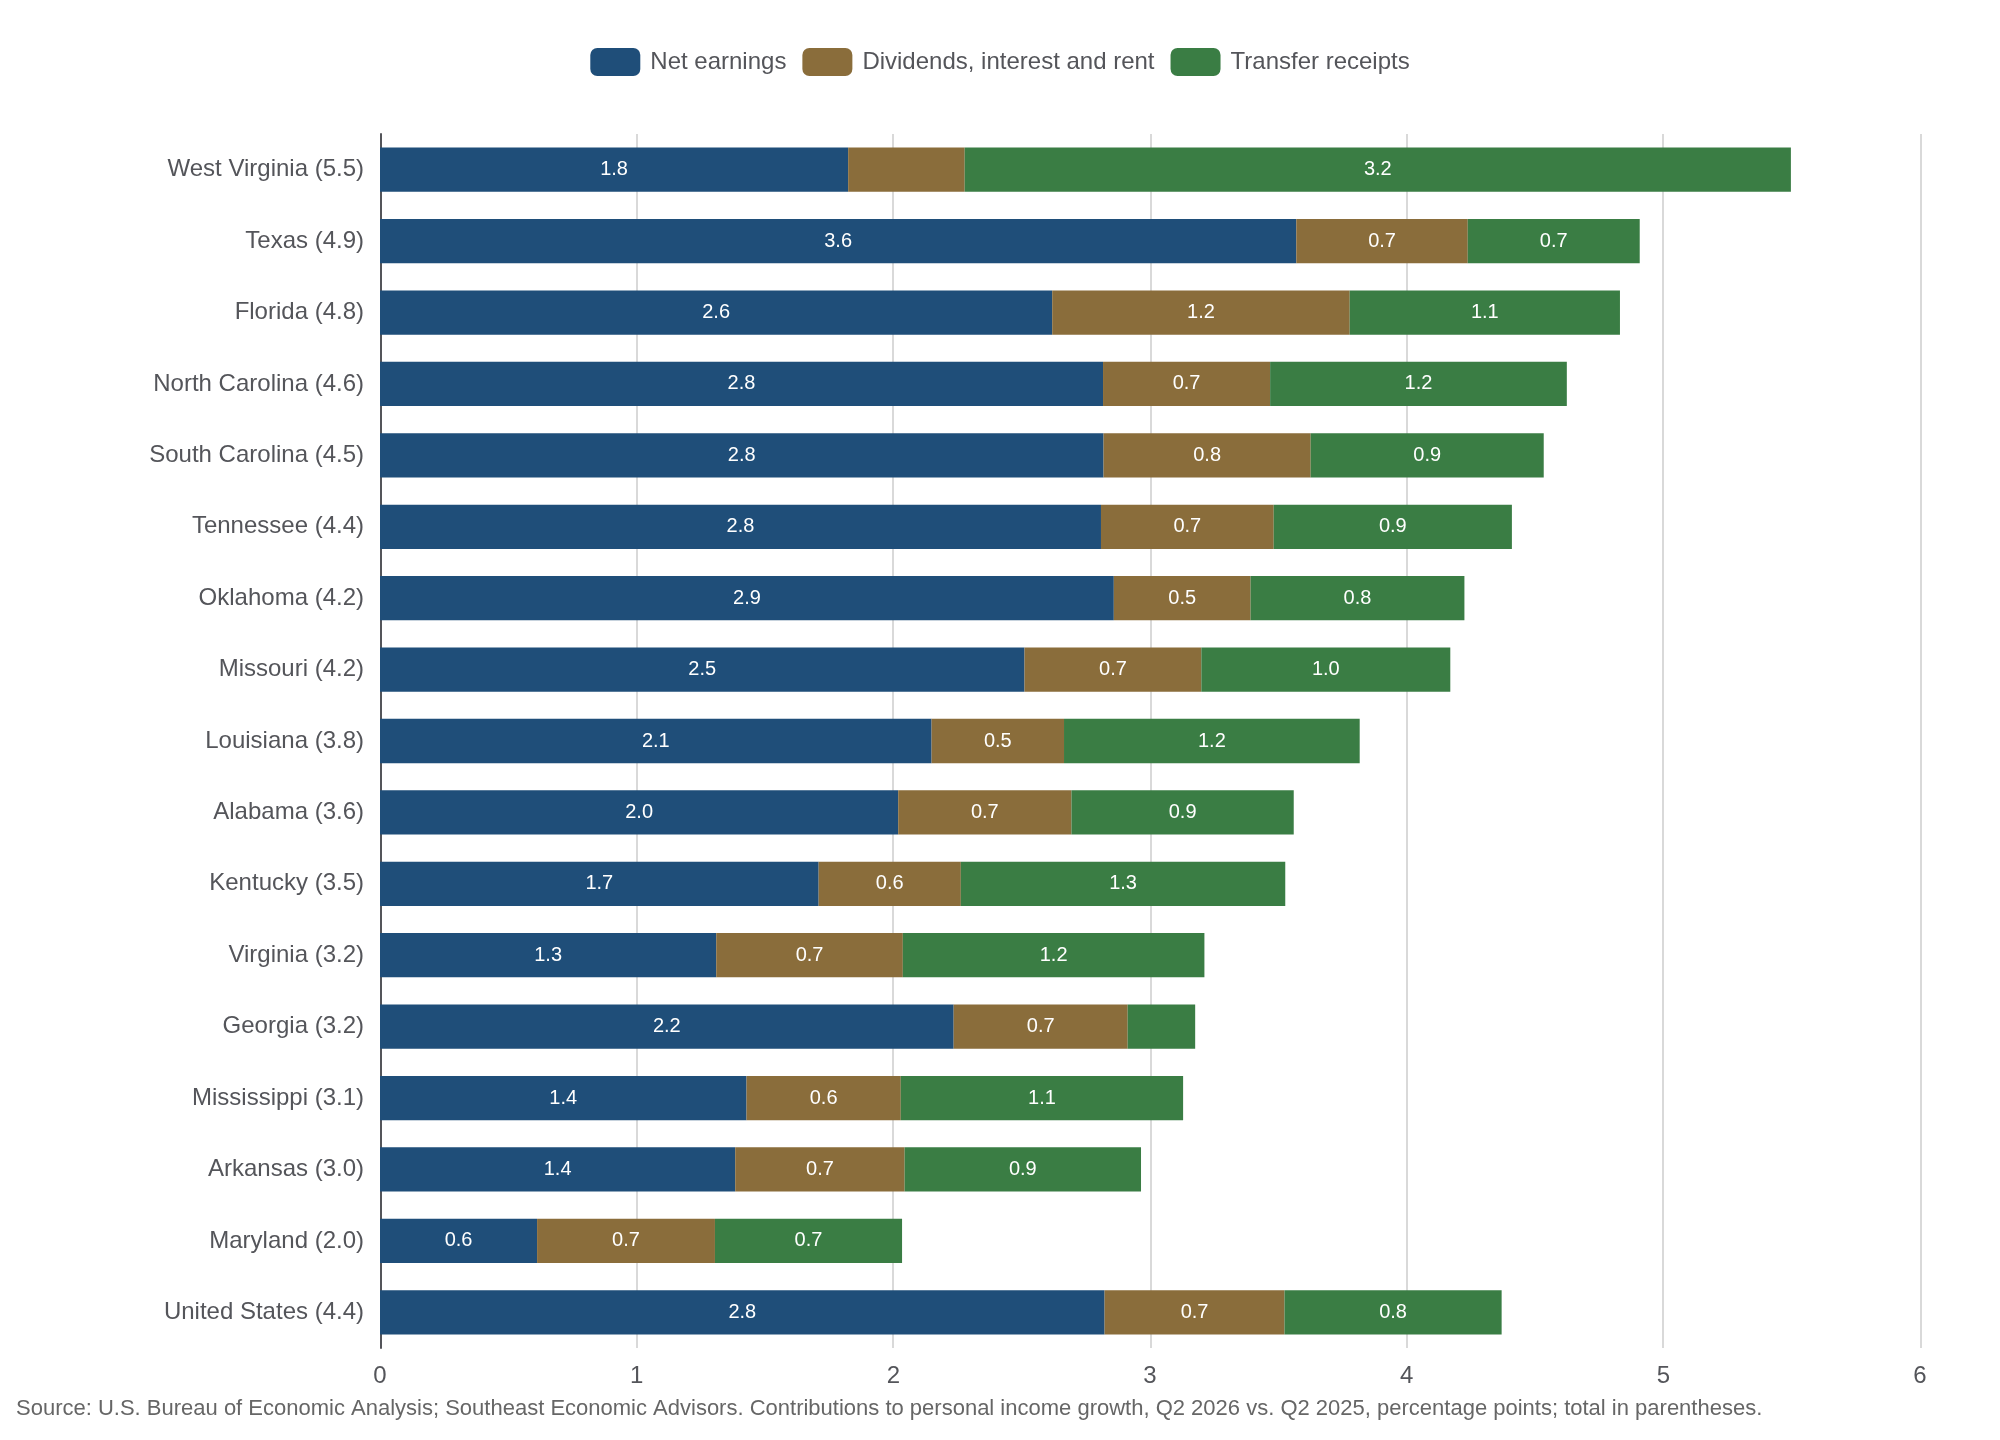
Personal income grew 4.4% nationally over the past year. Nebraska (+6.2%), Idaho (+6.1%), New York (+5.8%), West Virginia (+5.5%) and Texas (+4.9%) were the fastest in the country, and the last two are Southern. The sources differ sharply, however. Net earnings supplied 3.6 of Texas’s 4.9 points, while transfer receipts supplied 3.2 of West Virginia’s 5.5. Florida (+4.8%) drew 1.2 points from dividends, interest & rent, the most of any Southern state. At the low end, Maryland (+2.0%) had net earnings contribute only 0.6 points, and Arkansas (+3.0%), Georgia (+3.2%) and Virginia (+3.2%) also trailed the nation.
Florida’s reliance on investment income reflects its large retiree base. Dividends, interest & rent supply 31.5% of personal income in Florida, the second-highest share in the country behind Wyoming and well above the 21.4% nationally, while net earnings from work supply 49% against 60%. Older adults outnumbered children in Florida as early as 2020 (Census Bureau). Portfolio income accounts for all of the state’s 0.5-point edge over the nation in total income growth (1.2 points against 0.7), since earnings contributed less than they did nationally (2.6 points against 2.8). That income is less tied to local hiring than wages are, and we expect it to hold up while interest rates stay elevated, given our forecast of further Fed increases through 2027. The exposure runs the other way as well. A sharp decline in equity prices would reach Florida’s spending through lost wealth before it reaches reported income, because personal income excludes capital gains, and lower interest rates would cut the interest component directly.
Population growth explains much of why per person gains lagged. Adding residents lifts total income, but income per person grew more slowly than the nation’s 4.1% in five of the six fastest-growing Southern states: South Carolina (+3.2%, with population up 1.3%), North Carolina (+3.5%, 1.1%), Texas (+3.9%, 0.9%), Tennessee (+3.7%, 0.7%) and Georgia (+2.5%, 0.6%). Only Florida (+4.3%, 0.5%) beat it. West Virginia and Louisiana show the opposite pattern, with income per person rising 5.7% and 3.9% while their populations shrank. Who is relocating also matters. Retirees account for a disproportionate share of newcomers to the South, and they have considerable wealth but relatively modest annual income, which holds down measured income per person even as they add to spending and housing demand. Recent college graduates and young, single job seekers also account for a large share of the region’s growth, particularly in metro areas such as Atlanta, Charlotte, Miami, Raleigh and Nashville, and they start at entry-level pay. International migrants have supplied a larger share of recent growth as well, particularly in Florida, Texas and Georgia. In 2025 net international migration to Florida (about 179,000) was roughly eight times net domestic migration (about 23,000), and Texas added about 167,000 from abroad, although the Census Bureau reports that international migration slowed sharply in 2025, which would cool population growth itself.
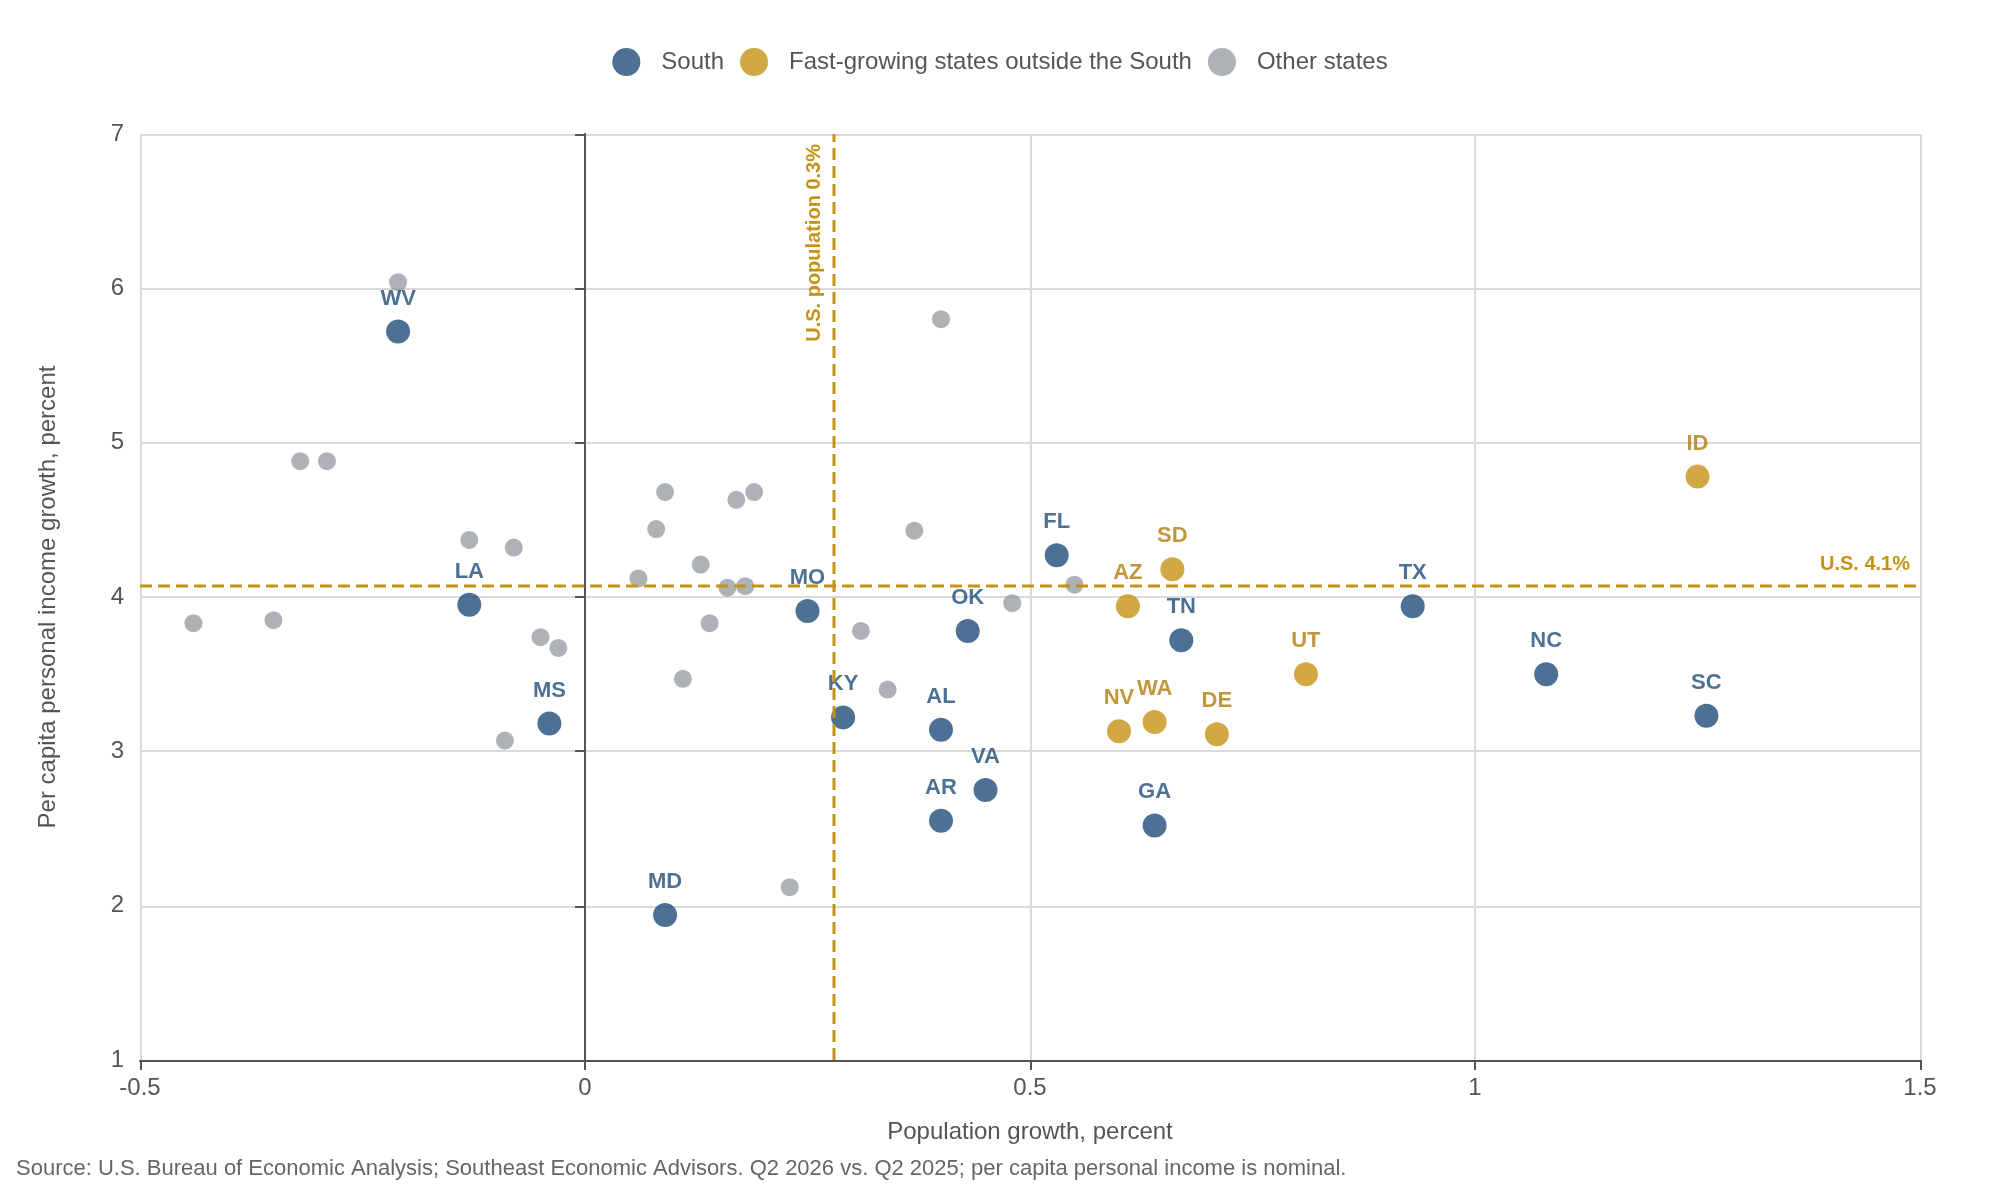
The pattern appears in other fast-growing states, although not in all of them. Among the 12 states with the fastest population growth over the past year, five of them Southern, only Idaho (+4.8%, with population up 1.3%, second only to South Carolina) and South Dakota (+4.2%) beat the nation’s 4.1% gain in income per person. Utah (+3.5%, with population up 0.8%), Arizona (+3.9%, 0.6%), Washington (+3.2%, 0.6%), Nevada (+3.1%, 0.6%) and Delaware (+3.1%, 0.7%) trailed it, and across all 50 states faster population growth has gone with slower income per person growth over the past year (a correlation of -0.26). The shortfall fades over longer periods, however. Since the second quarter of 2019 income per person has risen at annual rates of 6.2% in Utah, 5.9% in Arizona and 5.6% in Idaho, against 5.4% for the nation, and 13 of the 19 states whose populations grew faster than the nation’s over that period also beat it on income. Outside the South nine of ten did, while in the South only four of nine did, and the laggards were Georgia (4.7%), South Carolina (5.2%), Texas (5.2%), Oklahoma (5.2%) and Alabama (5.3%). That difference likely reflects, at least in part, the mix of newcomers described above and the jobs they take, although these data do not test it. For Southern markets the implication is that population gains should not be read as a proxy for rising living standards, and the gap between customer growth and spending power is widest in Georgia, South Carolina and Texas.
Consumer Spending
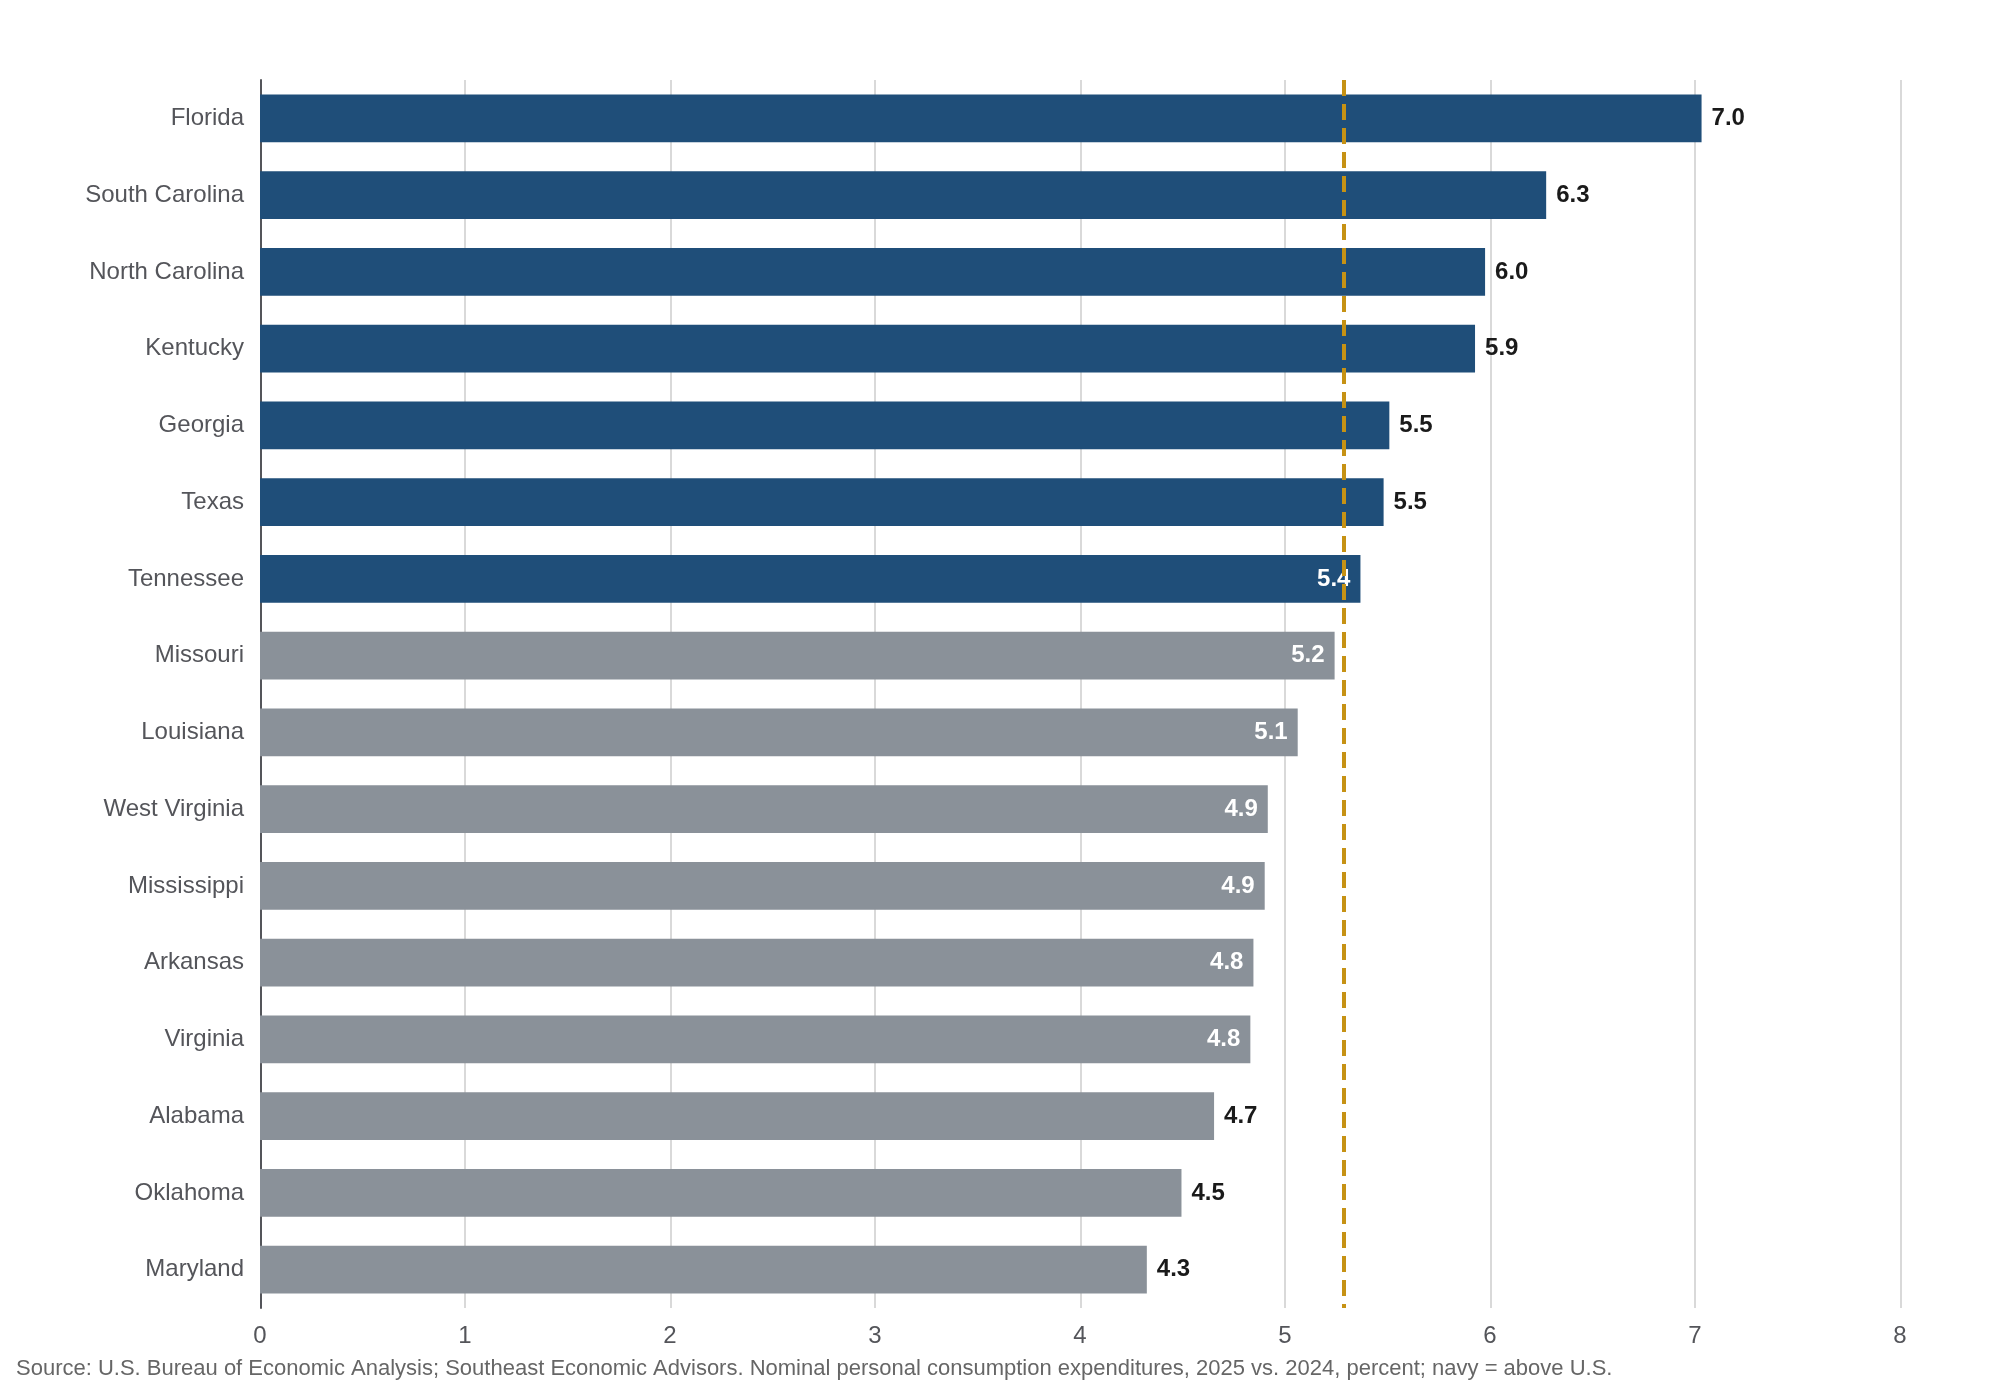
State personal consumption expenditures for 2025 were released with these figures. Nominal spending rose 5.3% nationally, and the Southeast’s 5.9% was the fastest of the eight regions while the Far West’s 4.5% was the slowest. Florida (+7.0%) led all states, with South Carolina (+6.3%), North Carolina (+6.0%), Kentucky (+5.9%), Georgia (+5.5%), Texas (+5.5%) and Tennessee (+5.4%) also above the national pace. Maryland (+4.3%) and Oklahoma (+4.5%) were among the four slowest in the country.
Spending grew faster than income in the South partly because the two series cover different periods. The income figures above are for the past year, while state spending data end in 2025. On a like-for-like basis personal income in the South rose 5.3% in 2025 against 5.1% elsewhere, close to the gap in spending (5.7% against 5.1%), and the income slowdown appears only in the most recent four quarters. Population explains nearly all of the spending advantage. The South added residents at a 0.9% pace in 2025 against 0.3% elsewhere, and spending per person rose 4.7% in both, while income per person rose 4.4% in the South against 4.7% elsewhere. Southern households therefore spent 0.3 points more than their incomes grew, which they can finance for a time by saving less or borrowing. Base effects play a smaller role. Spending per person in the South rose 4.3% in 2024 against 4.8% elsewhere, so the region’s match of the national pace in 2025 follows a year in which it lagged.
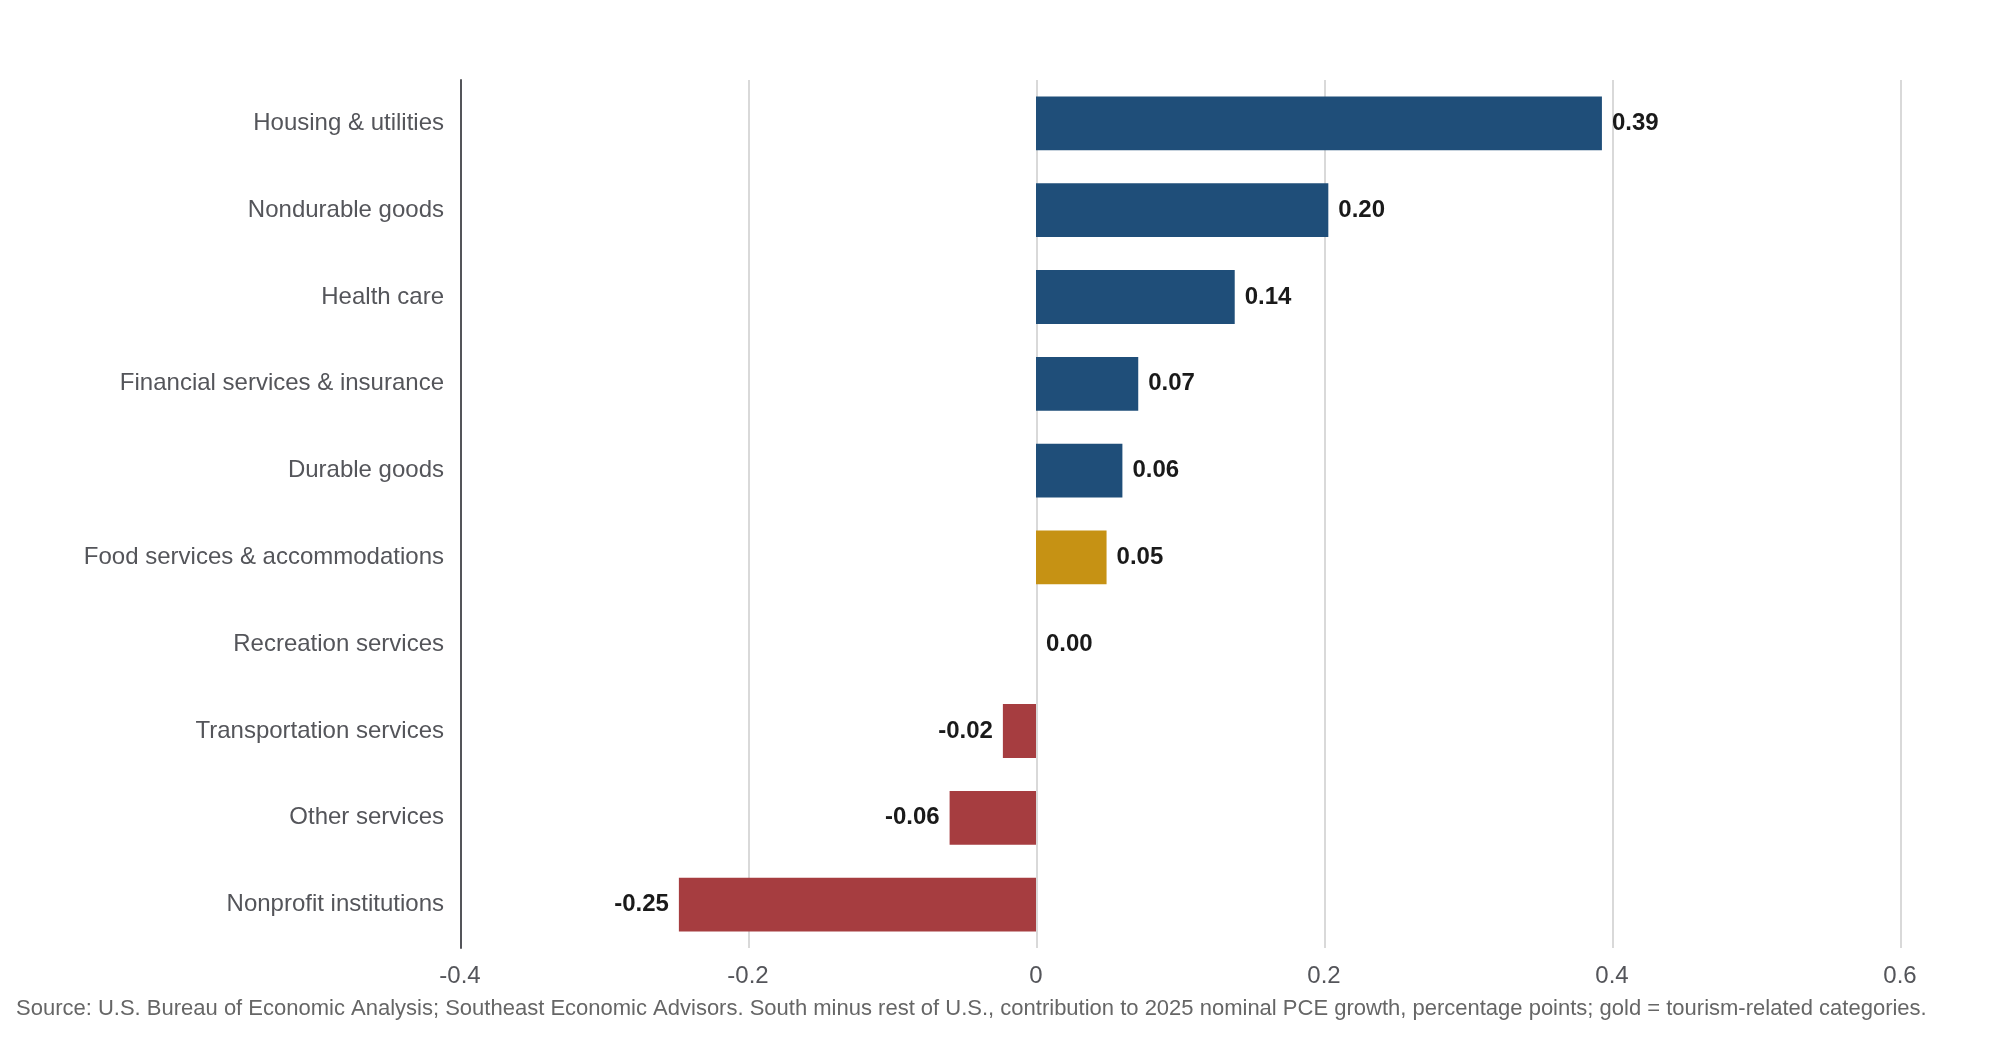
Tourism explains little of the gap. BEA assigns state consumer spending to the state where the consumer lives, so visitors’ purchases are credited largely to their home states, and the two categories that capture travel, food services & accommodations and recreation services, supplied 0.56 percentage points of spending growth in the South against 0.52 elsewhere. Housing & utilities supplied 0.39 of the South’s 0.58-point edge, nondurable goods 0.20 and health care 0.14. Florida’s 7.0% gain drew 2.0 points from housing & utilities (1.1 nationally), 1.7 from health care (1.2) and 1.0 from financial services & insurance (0.7), which includes insurance premiums, while food services & accommodations supplied 0.49 points (0.34). South Carolina’s 6.3% drew 1.75 points from housing & utilities and 1.01 from nondurable goods. GDP by industry is recorded where production takes place, so it does capture visitors’ spending, and it gives tourism somewhat more credit in South Carolina, where accommodation & food services added 0.20 points to second-quarter growth of 3.5%, than in Florida, where a 2.6% gain in accommodation & food services was offset by a 1.4% decline in arts, entertainment & recreation. Because the spending data are nominal, rising rents, utility bills and insurance premiums likely account for a good part of the housing-related gains.
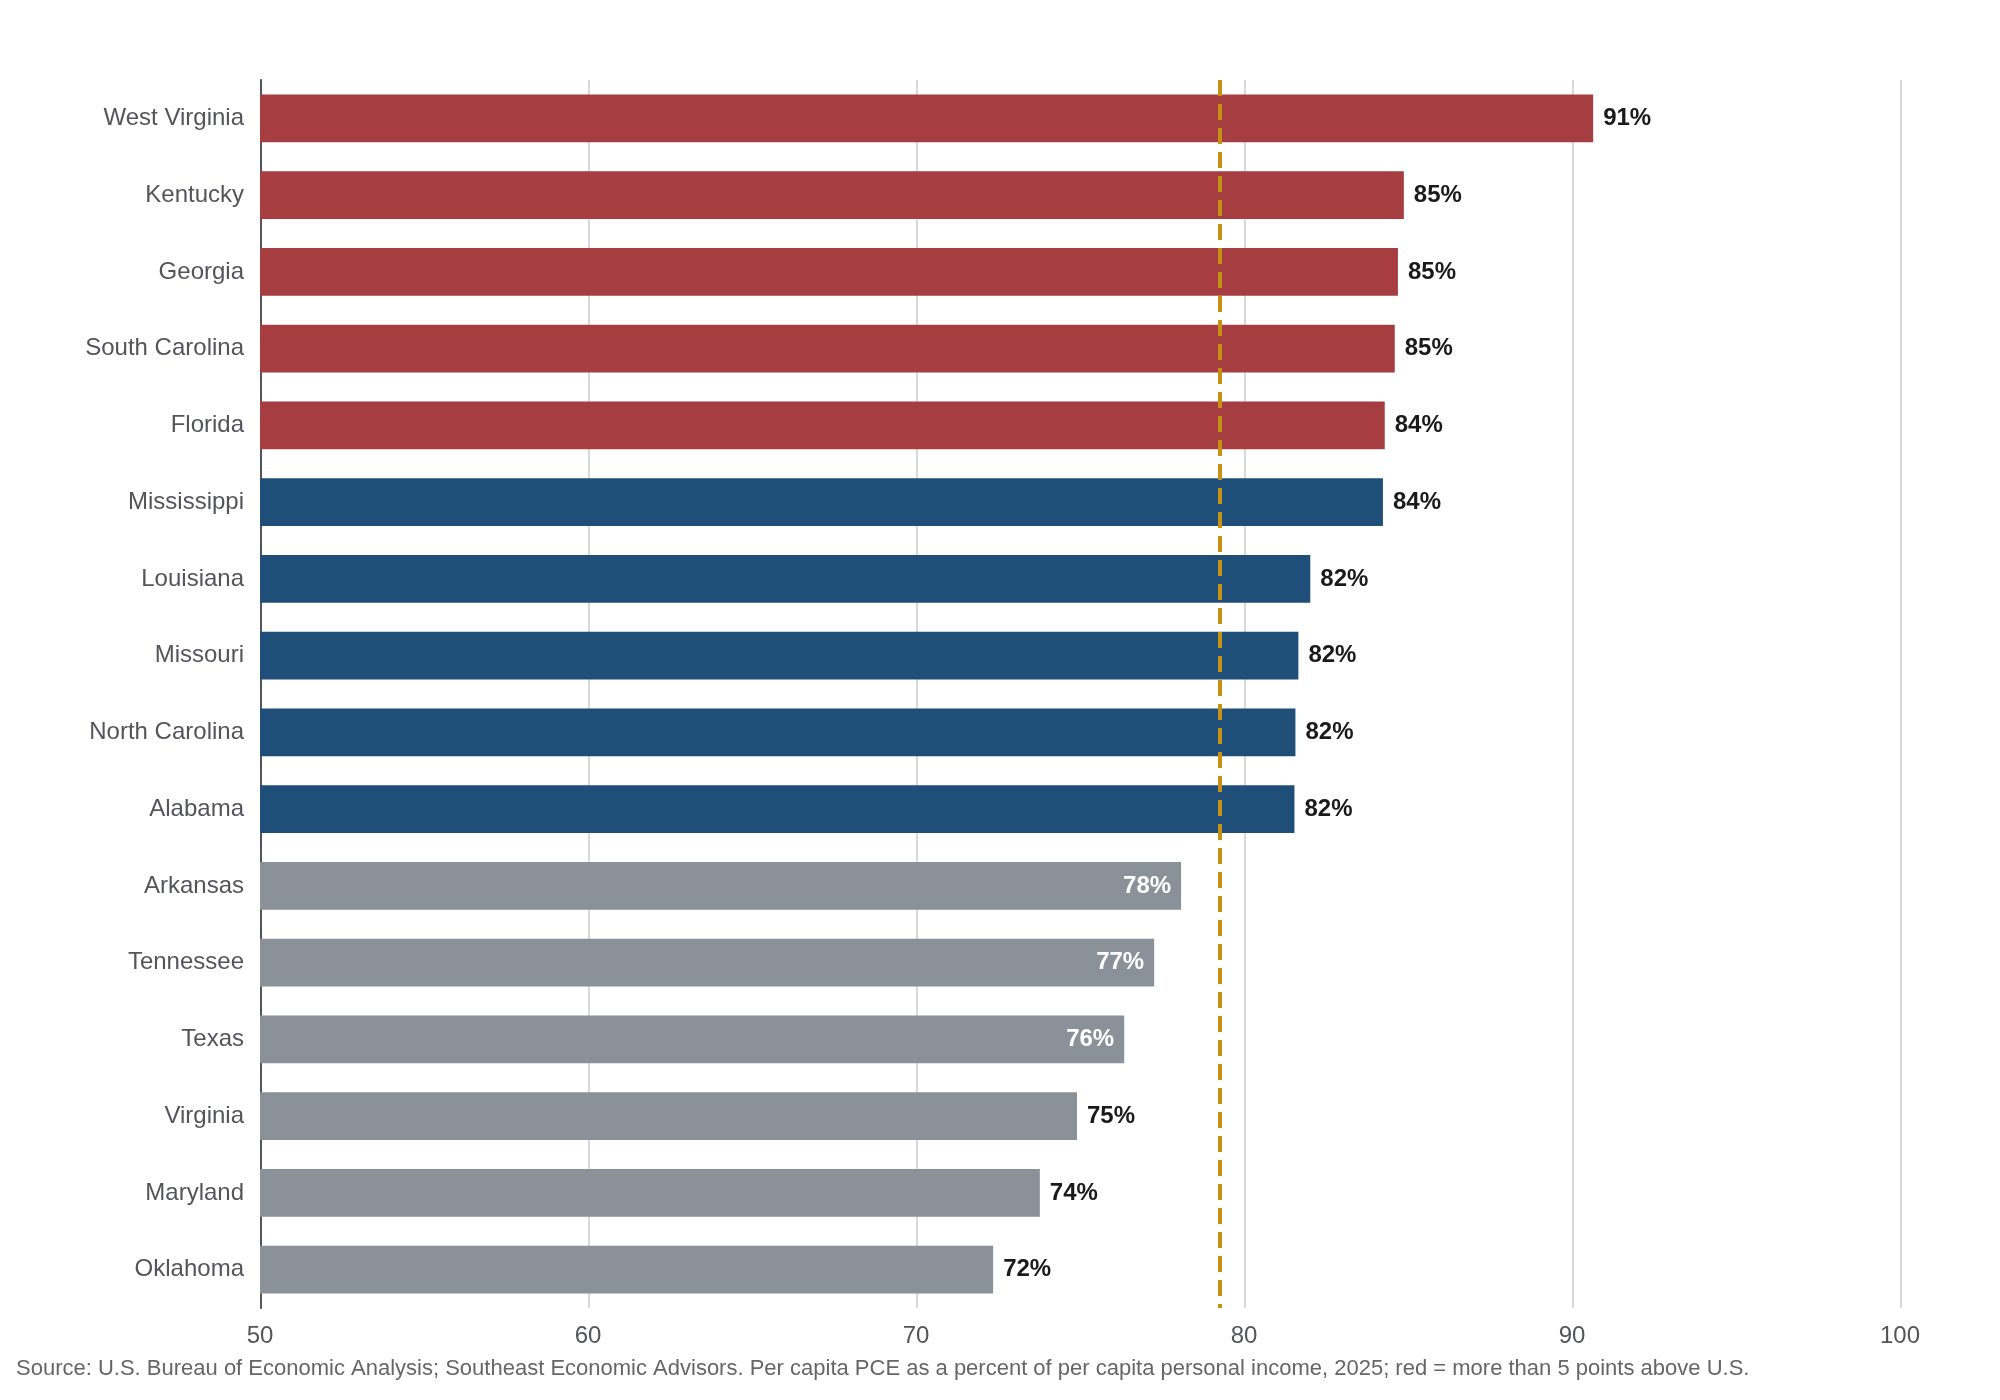
Levels tell a different story. Per person spending in 2025 was $45,855 in Mississippi, $47,797 in Oklahoma, $48,180 in Arkansas and $48,725 in Alabama, the four lowest in the country, against $66,061 in Florida and a national average of $61,062. Relative to income the picture is similar. Per person spending equaled 79% of per person income nationally, but 91% in West Virginia, 85% in Kentucky, Georgia and South Carolina and 84% in Florida and Mississippi, against 72% in Oklahoma, 74% in Maryland, 75% in Virginia and 76% in Texas. Part of the gap reflects health care that Medicare and Medicaid finance but that BEA counts as consumption, which raises the ratio in states with older and lower-income populations. Even so, the states at the top of the list have less room for spending to outrun income.
Our Take
Southern growth is running on population more than on income per person. The region is adding residents roughly ten times as fast as the rest of the country, while income per person is rising 0.8 percentage points more slowly (3.6% against 4.4%). Demand for housing, health care and other services in the South should keep outgrowing the nation’s as long as migration stays strong, but a good part of the spending gain in housing & utilities and insurance reflects higher costs, which squeeze households whose incomes per person are growing more slowly. Manufacturing in the South will likely lag the national pace while nondurable output, which is concentrated in Louisiana, North Carolina, Mississippi, Kentucky and Texas, keeps falling. Florida’s income and spending depend on portfolios more than on payrolls, so its exposure is to financial markets and interest rates rather than to hiring.
We expect the third-quarter state personal income data, due in December, to show income per person in the South still rising at least 0.5 percentage points more slowly than elsewhere (0.8 points now), and population growth in the South remaining above the nation’s. A narrower gap would mean the lag is fading faster than we think. If migration slows before income per person catches up, the region’s advantage in total spending would narrow quickly.
Chief Economist, Piedmont Crescent Capital / Southeast Economic Advisors
Sources & Notes
Sources: U.S. Bureau of Economic Analysis, Gross Domestic Product (Third Estimate), Industries, Corporate Profits, State GDP, and State Personal Income, 2nd Quarter 2026; State Personal Consumption Expenditures, 2025 (released September 30, 2026), including Regional Accounts tables SQGDP1, SQGDP9, SQGDP11, SQINC1, SQINC4 and SAPCE1 through SAPCE5. Also U.S. Census Bureau, older adults outnumber children release (June 2025); Descartes Labs, Global Shipping Report (July 2026); South Carolina Ports Authority container volumes as reported in September 2026; Census Bureau, Vintage 2025 population estimates release (January 2026).
Notes: The South is defined here as 16 states (listed in the first paragraph). Regional and South-versus-rest real GDP growth rates and industry contributions are weighted by nominal GDP; income, population and spending aggregates sum state levels; and the rest of the U.S. comprises the other 34 states and the District of Columbia. Nondurable and durable goods shares are computed from chained-dollar values and are approximate; BEA suppresses Maryland nondurable and Louisiana durable goods output, and those states are omitted from the regional aggregates for that industry. Per person figures for 2025 use annual averages of quarterly income and population, and the Florida and South Carolina spending detail uses BEA’s contribution tables (SAPCE5). Regional groupings in Exhibit 1 are BEA’s. State contributions to the national information figure weight each state’s contribution by its share of nominal GDP and sum to 0.58 points against the national 0.57. State personal consumption expenditures are annual and nominal.