
The Week Across the South
September payrolls rise just 29,000 and cut October rate-hike odds to near zero, the ten-year holds near two-decade highs, and Memphis and Pulaski County head toward decisive data center votes.
At a Glance
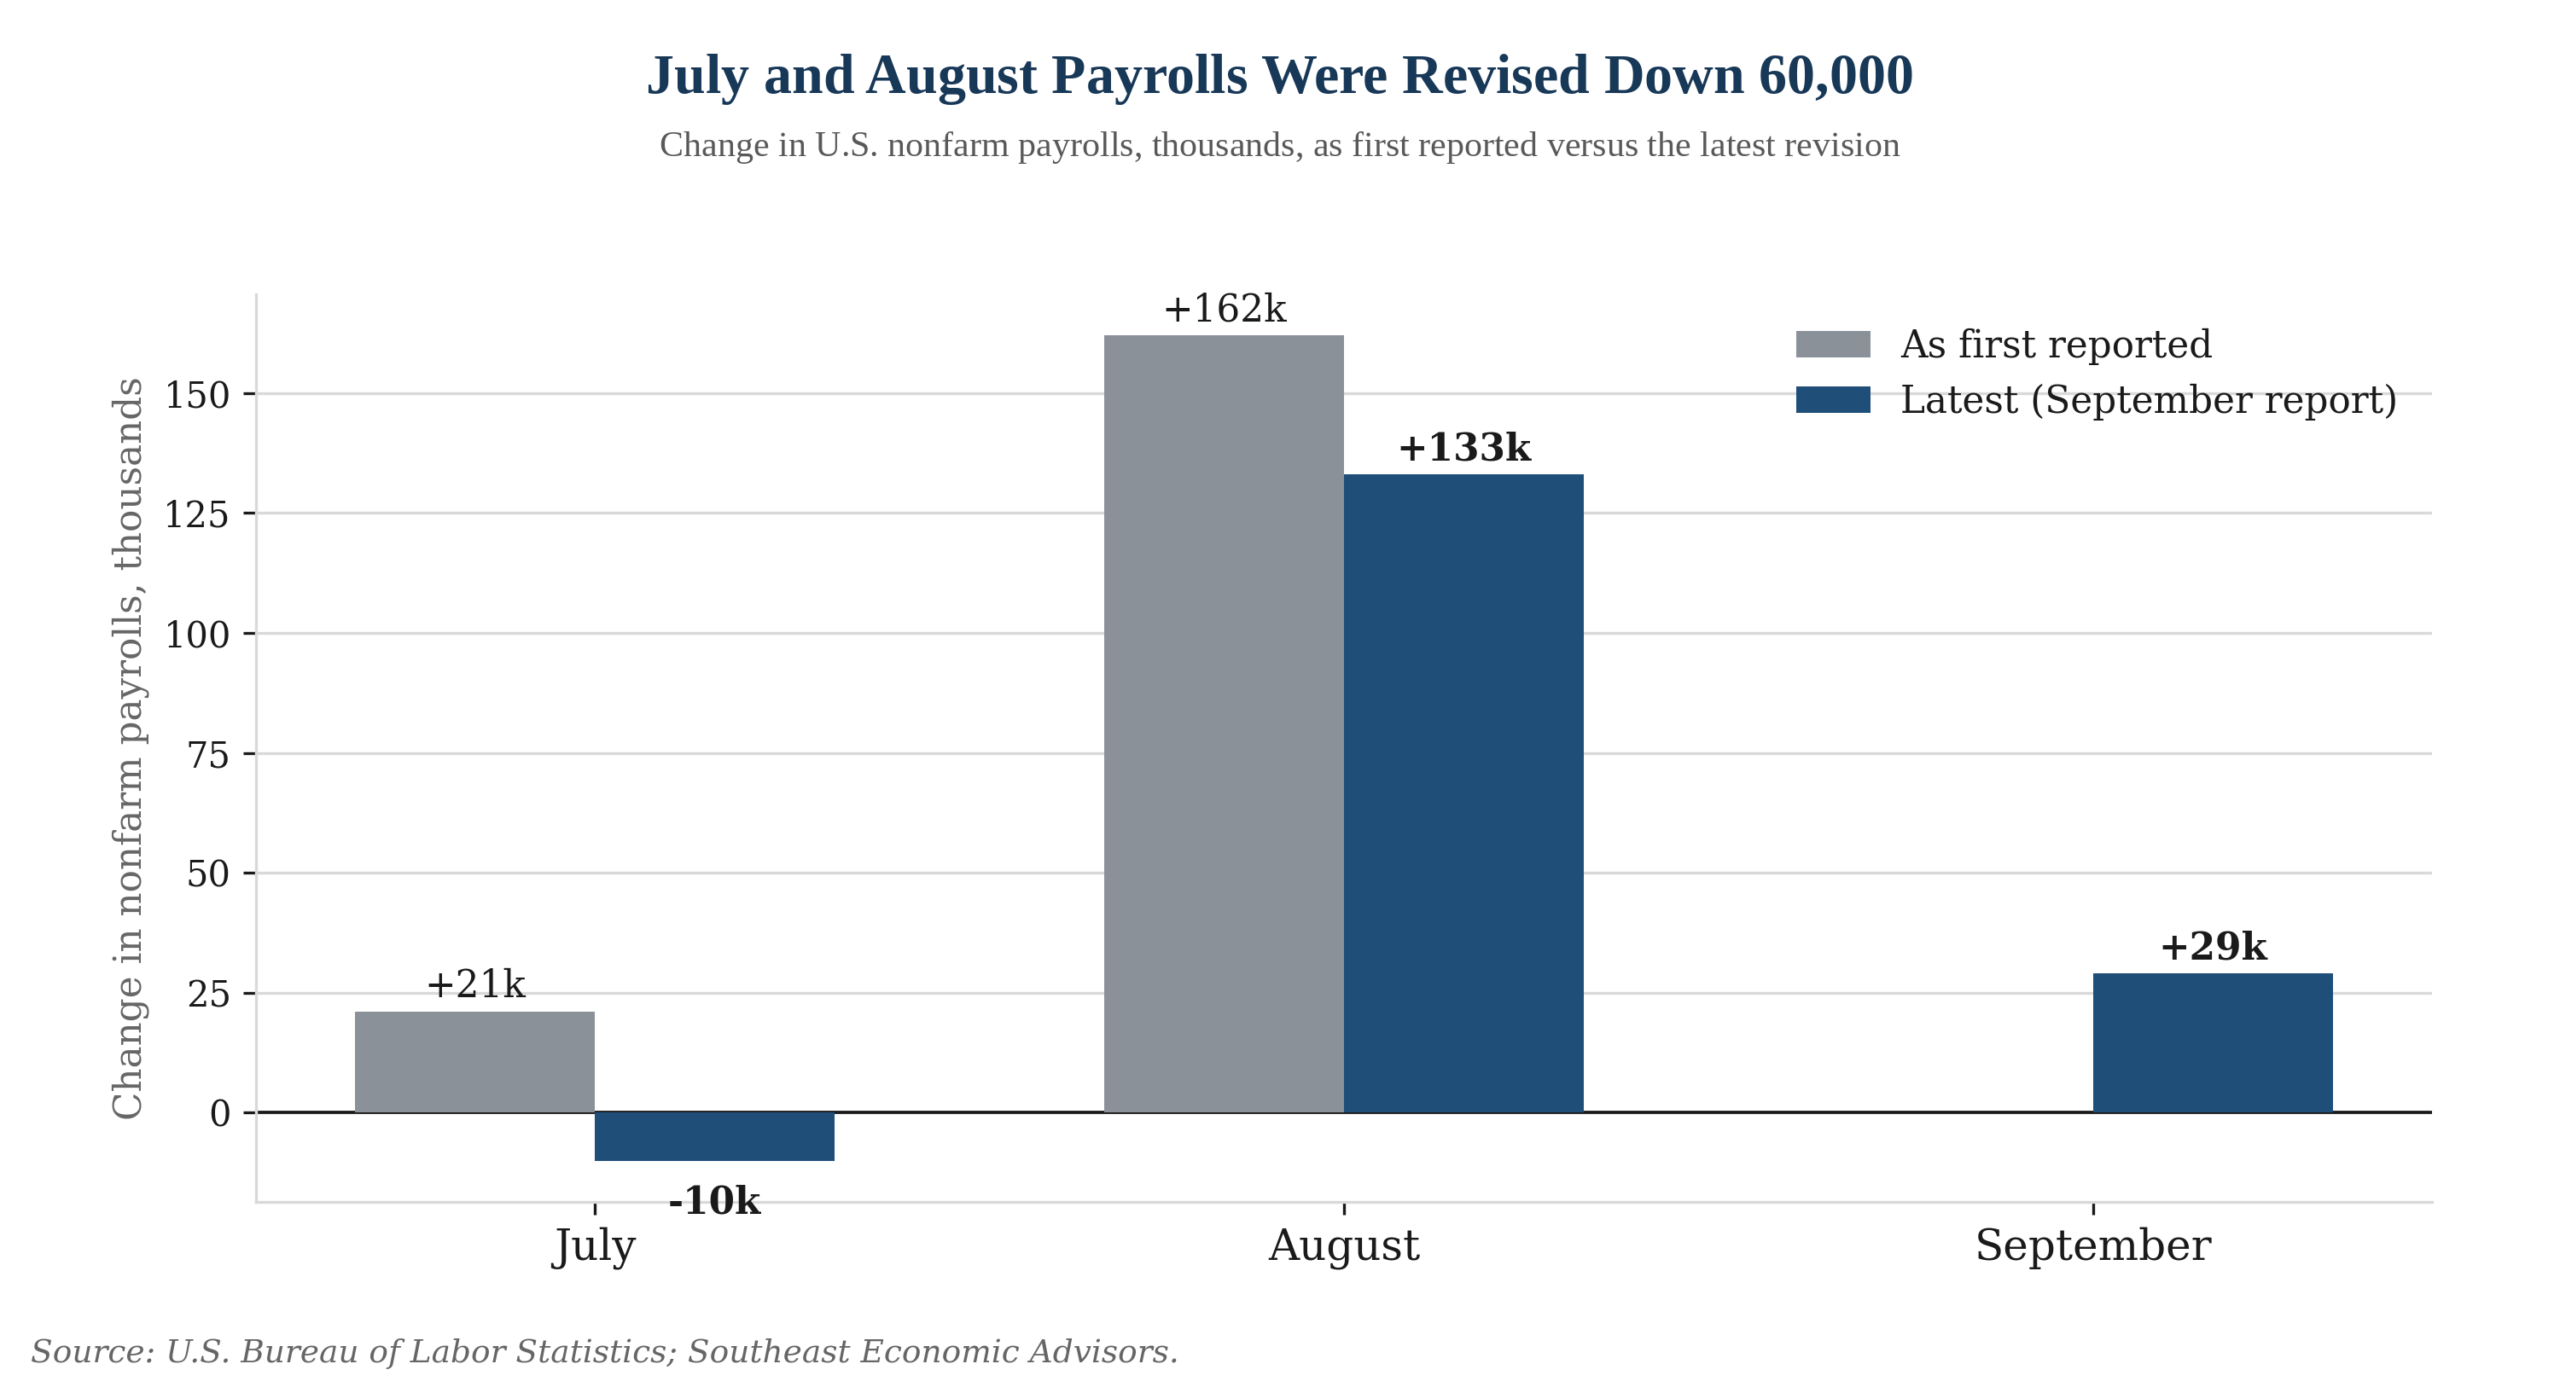
- Nonfarm payrolls rose just 29,000 in September; the unemployment rate ticked up to 4.2%, and July and August were revised down a combined 60,000.
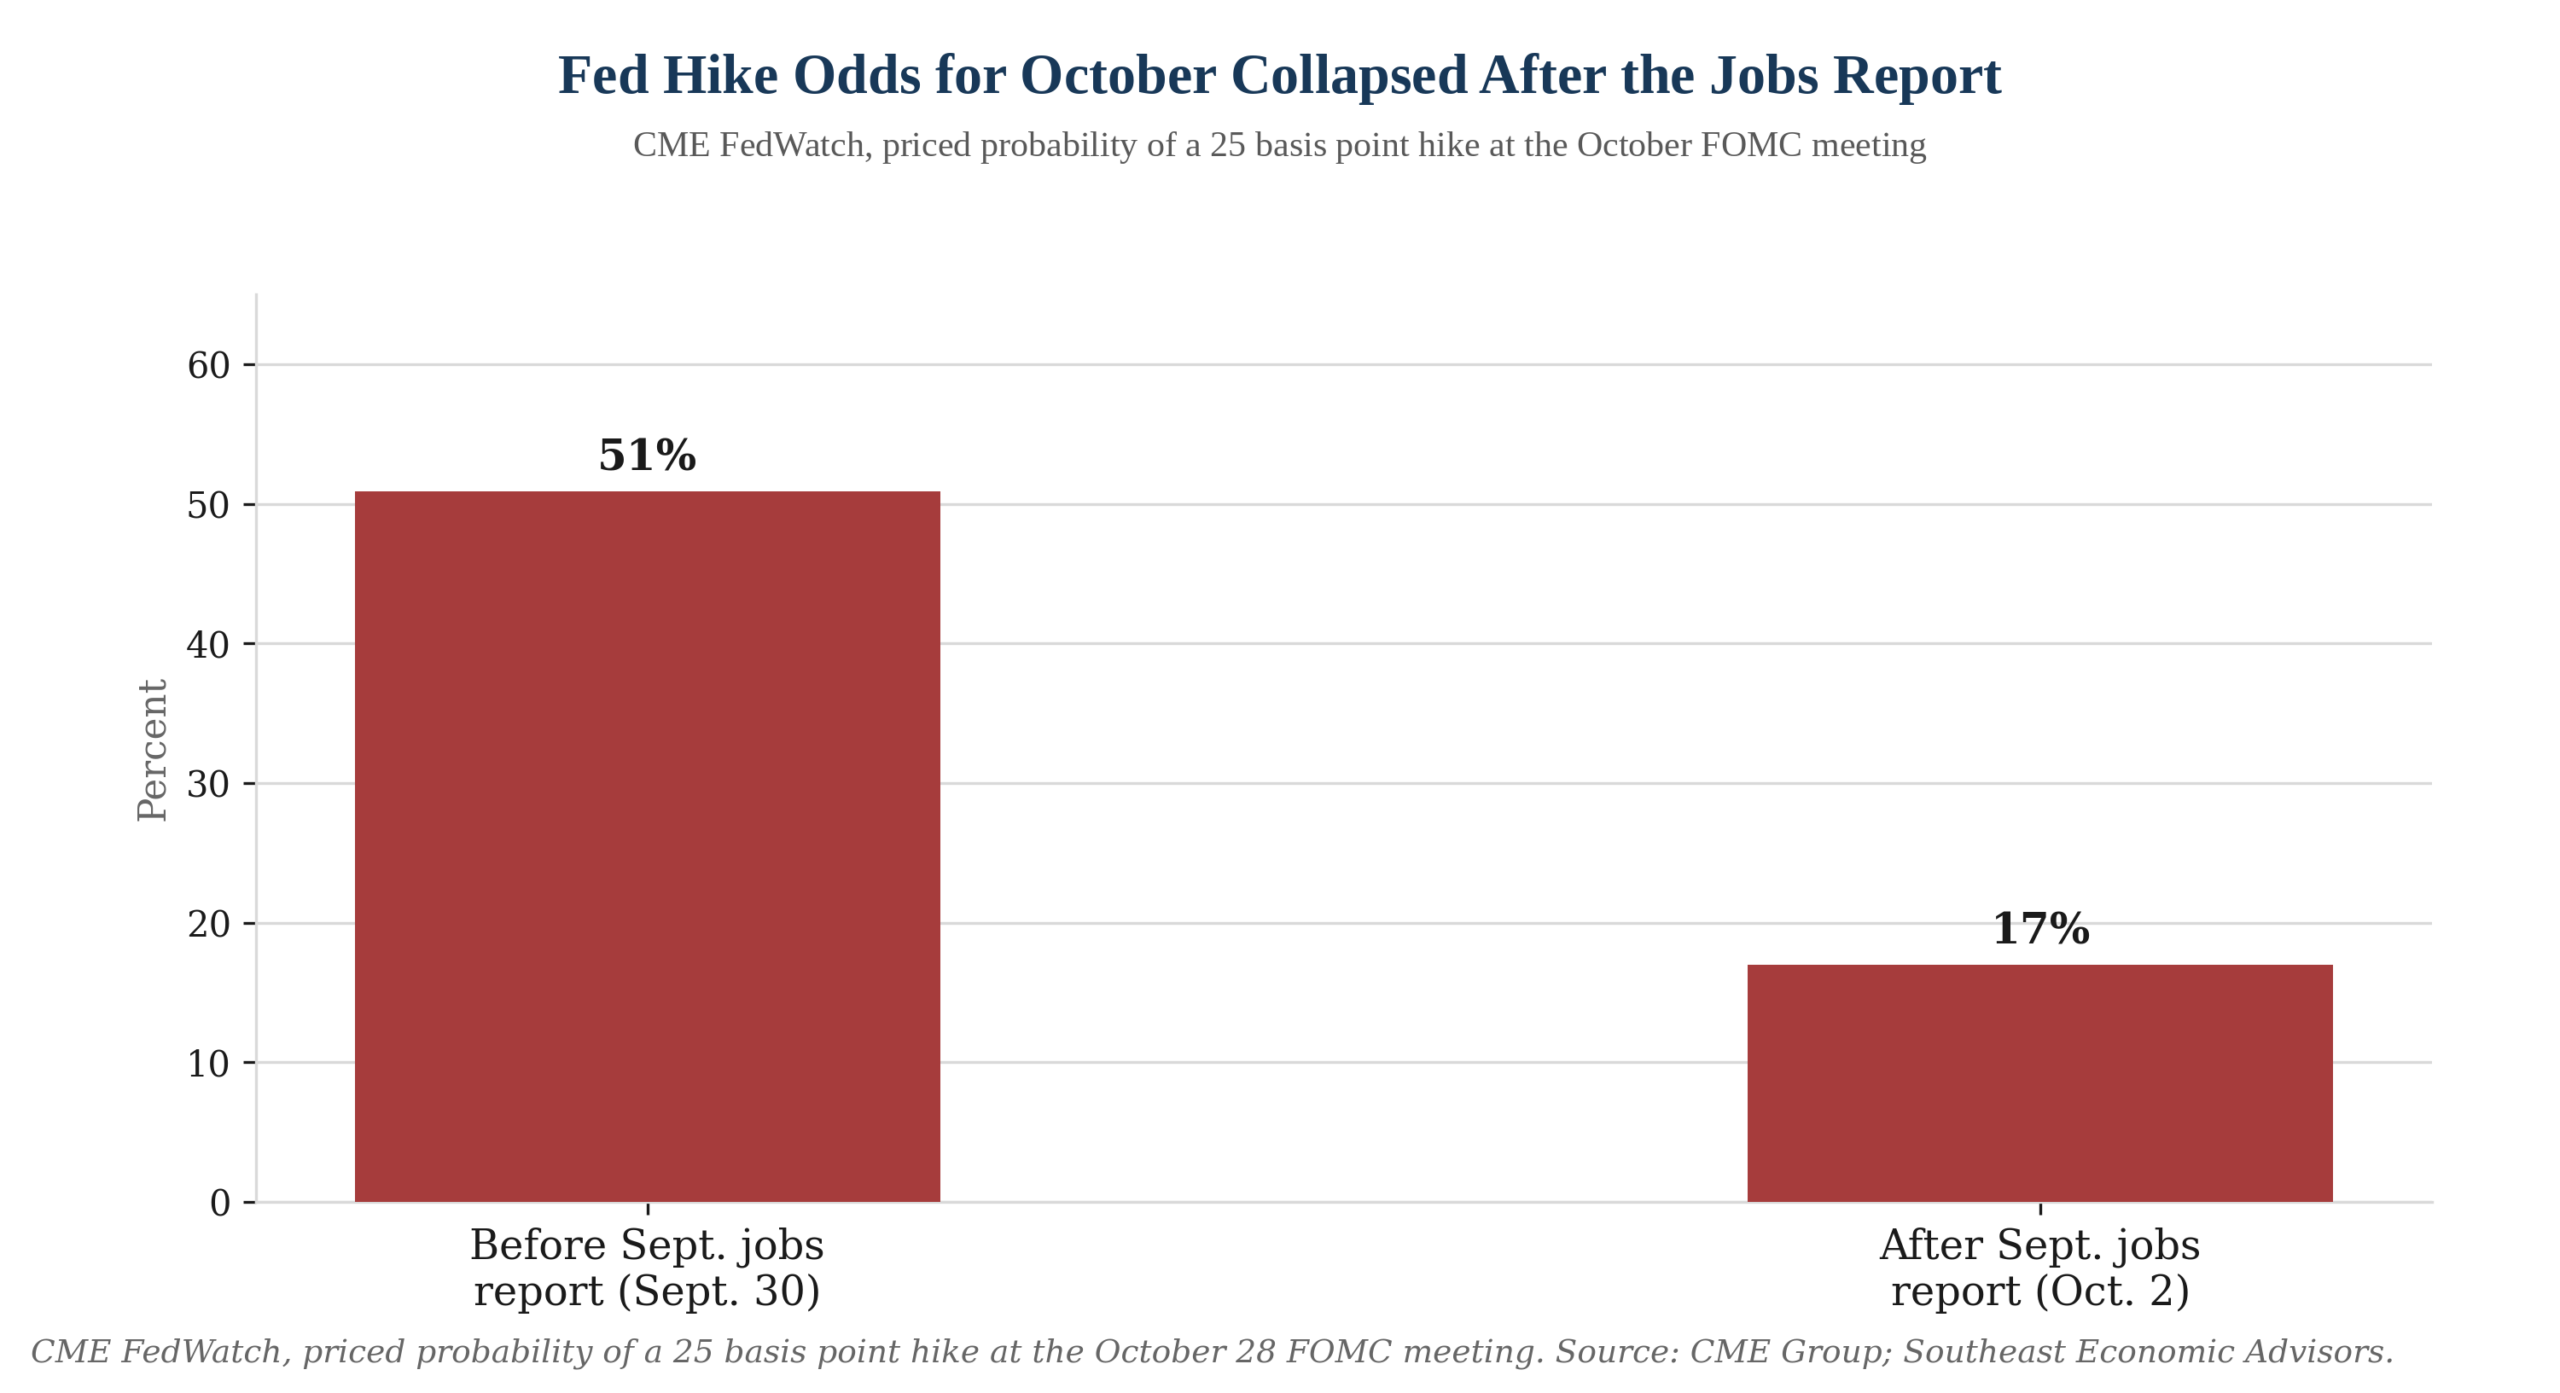
- Odds of an October 28 Fed hike collapsed from about 51% to roughly 17% on CME FedWatch; most of the probability shifted to the December 9 meeting.
- The 10-year Treasury pulled back from a fresh two-decade high near 5.28% to just above 5.2% on the jobs report.
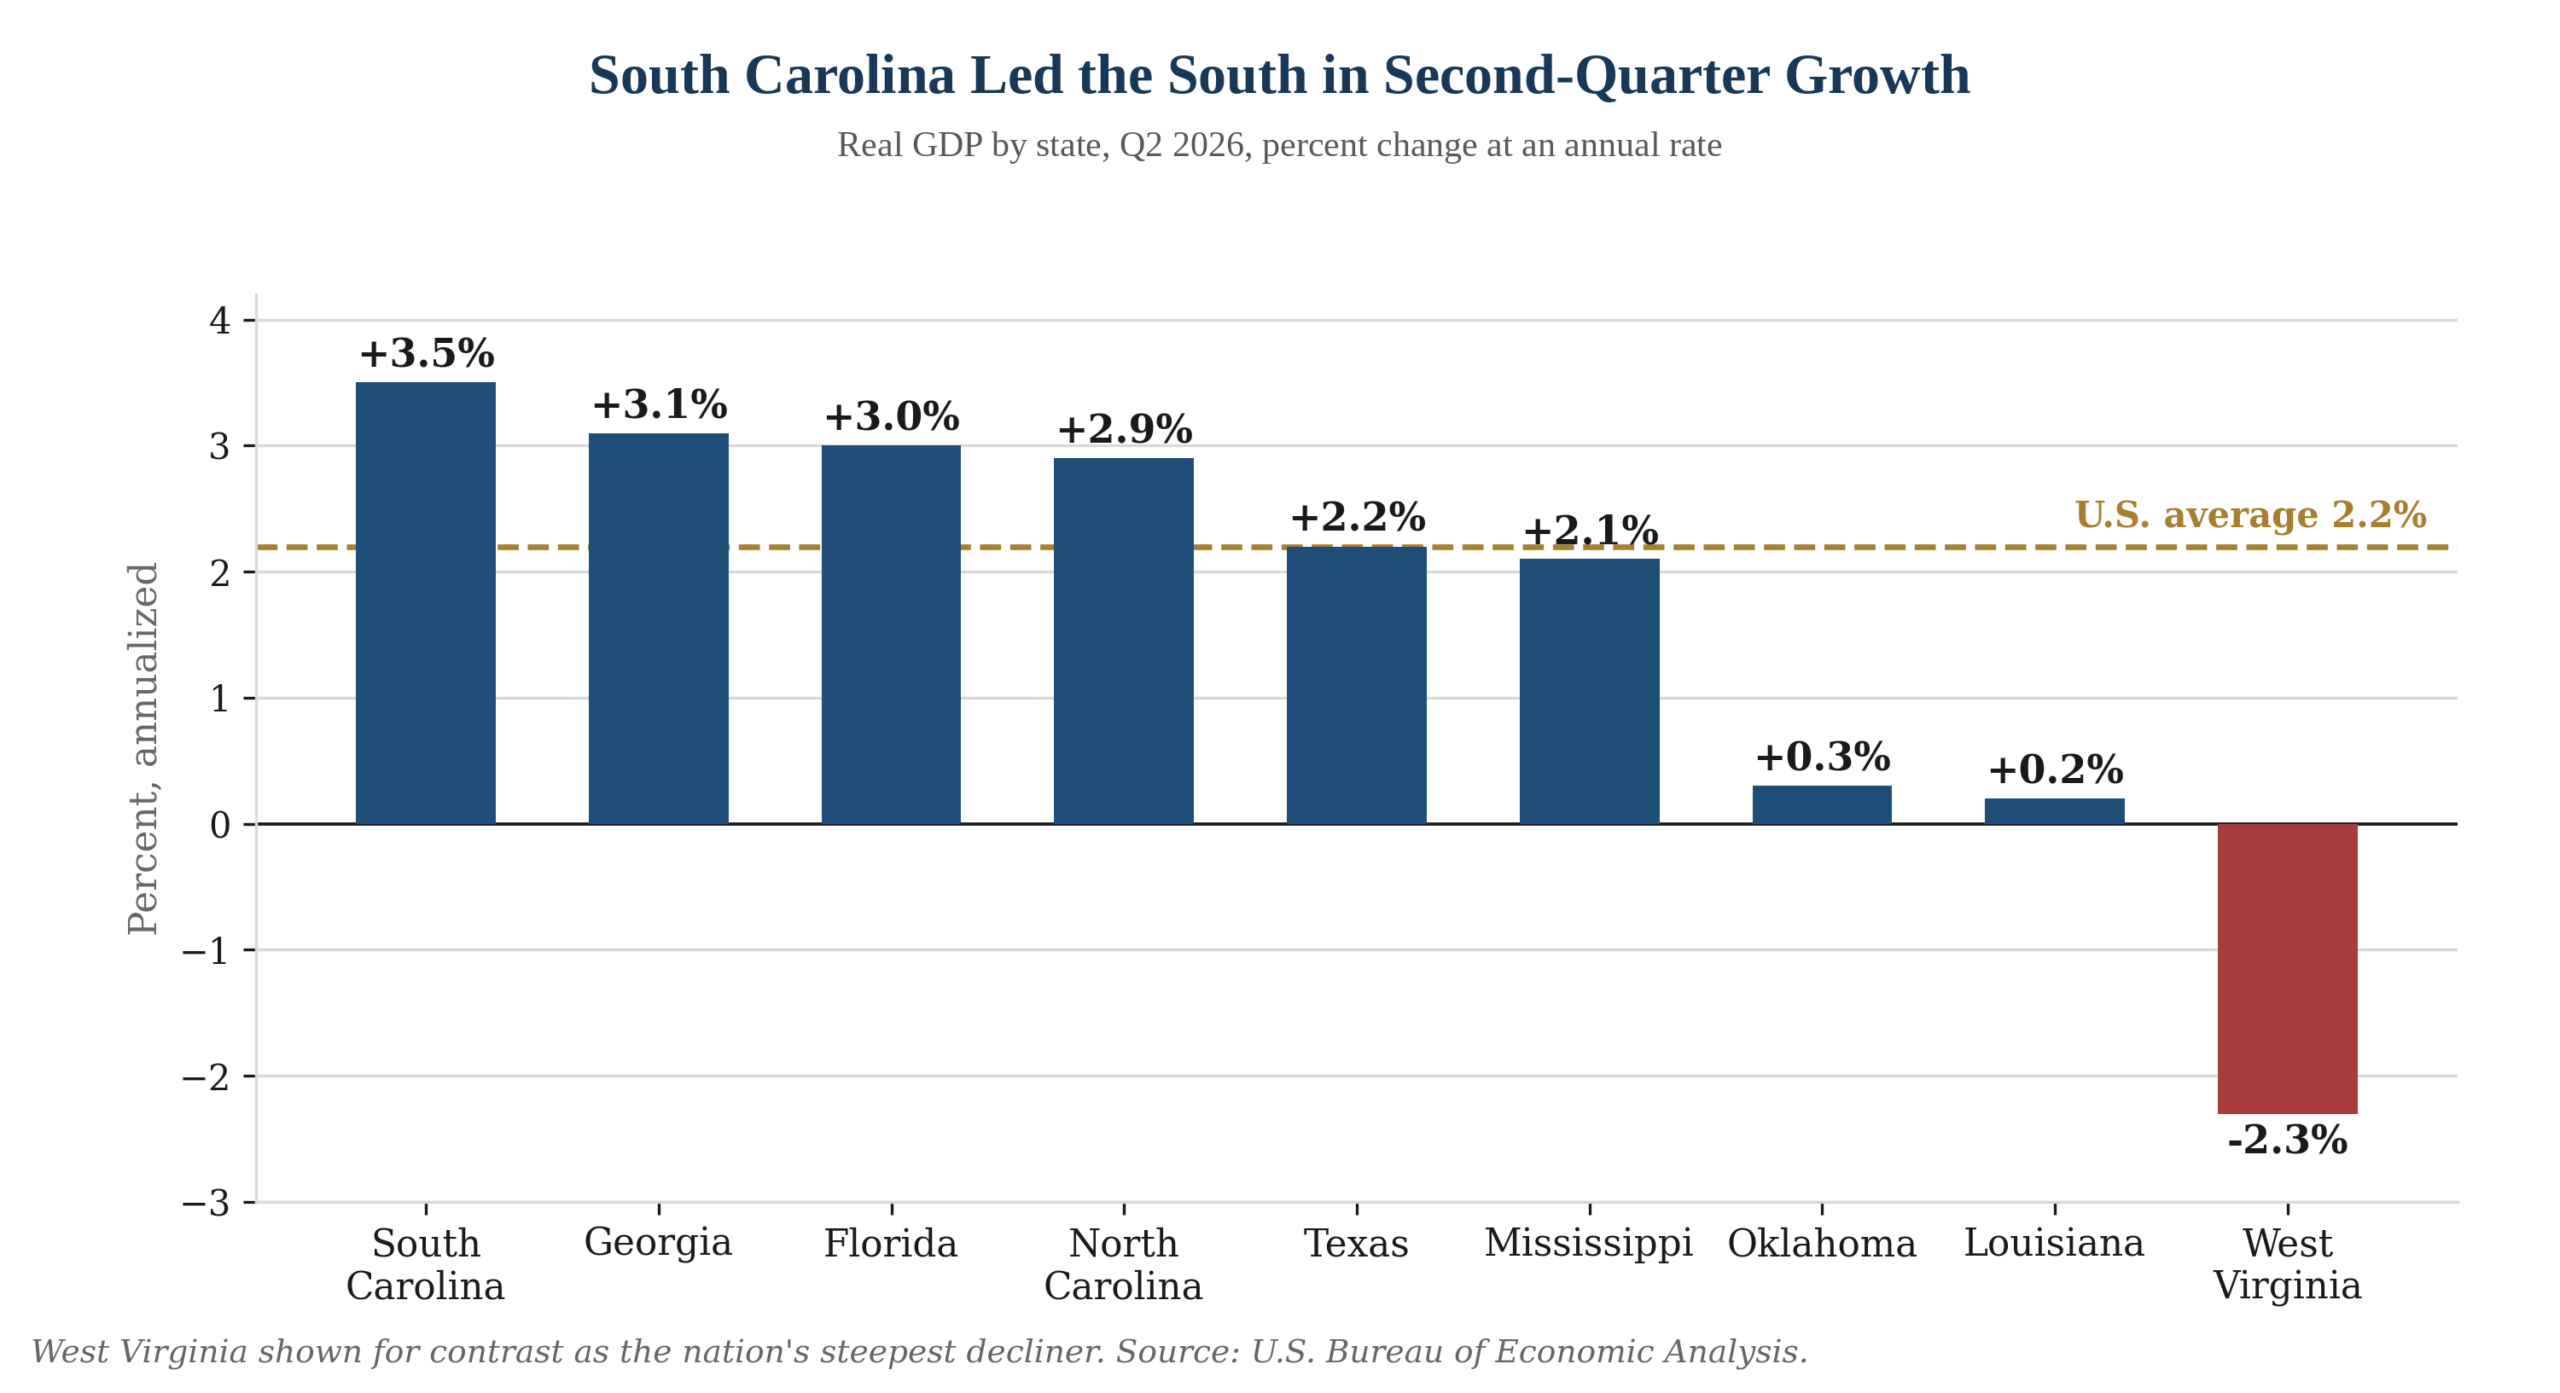
- South Carolina led the South in second-quarter GDP growth at 3.5%; West Virginia posted the nation's steepest decline, down 2.3%.
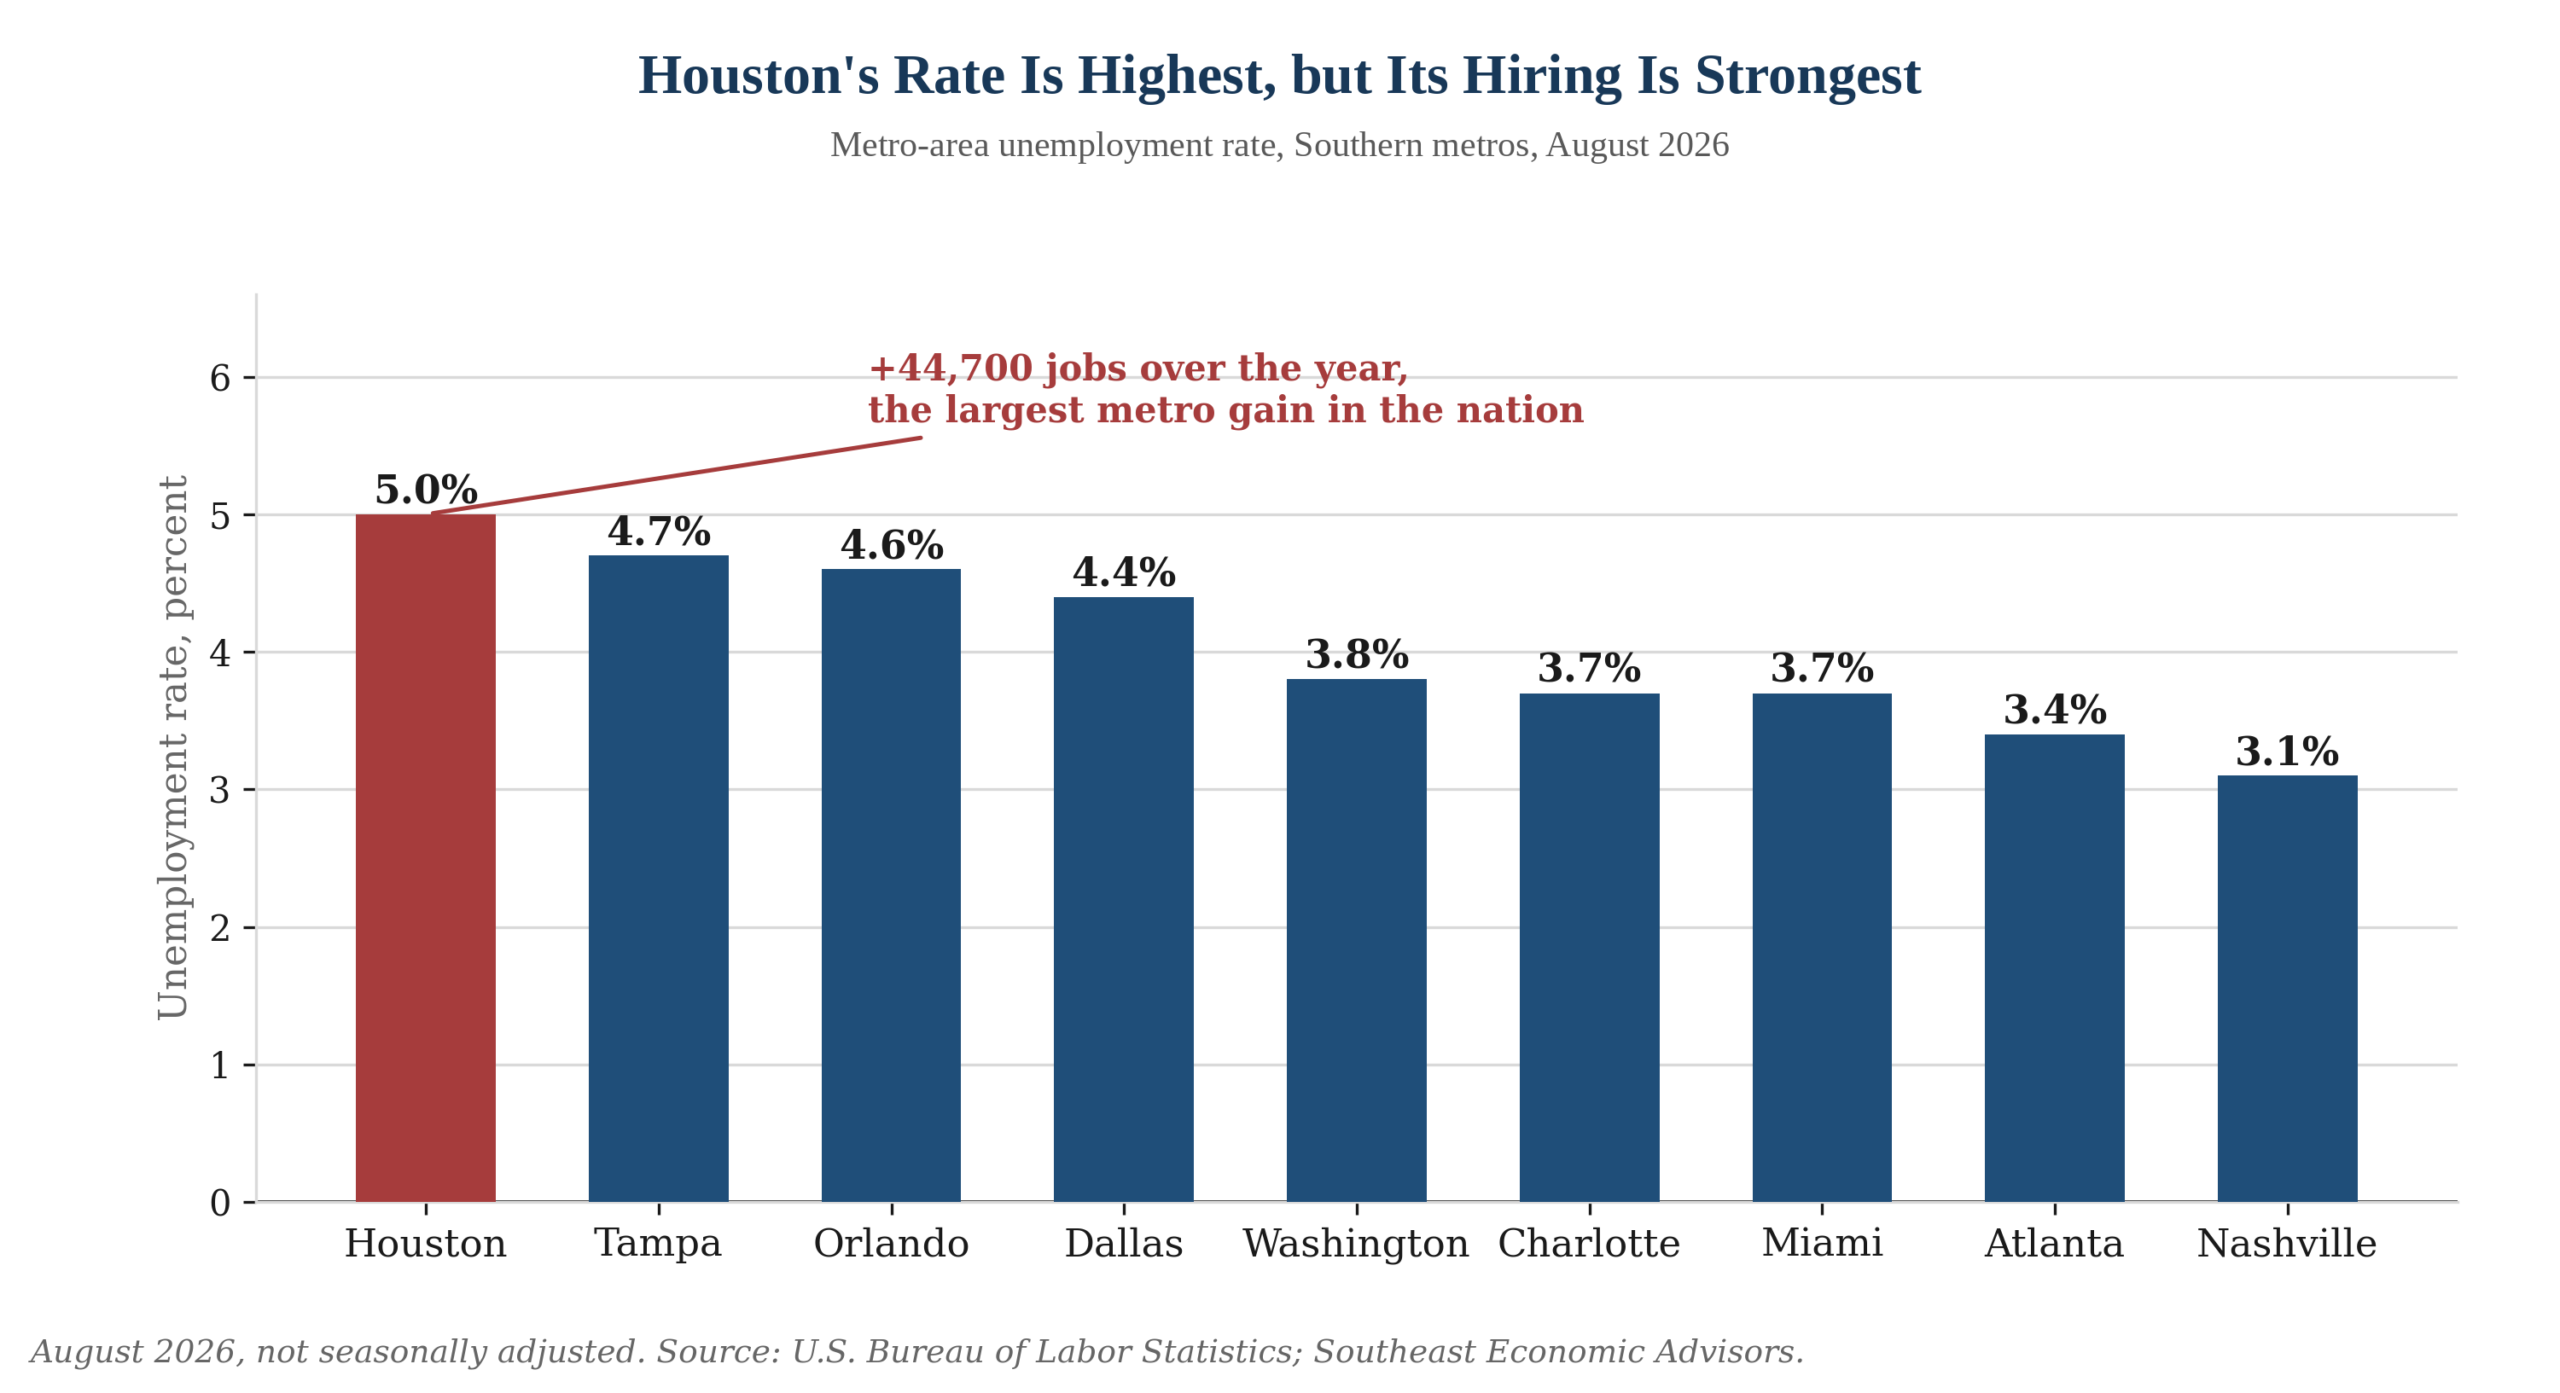
- Houston carried the highest unemployment rate of any major Southern metro, 5.0%, but also the nation's largest metro job gain, +44,700 over the year.
- Memphis and Pulaski County, Arkansas both head toward decisive data center votes this week, even as capital keeps arriving elsewhere in the region.
Seven Key Themes for the South
All seven key themes stayed in motion this week, though the sharpest new evidence came from the labor market rather than the buildout itself. We track the AI buildout, the energy infrastructure upgrade, defense replenishment, civilian aerospace expansion alongside the next generation defense buildup, the reshoring of critical industries and materials, a new era of pharmaceutical investment and Peak 65’s effect on both labor supply and spending. The scoreboard below pairs each with the week’s evidence.
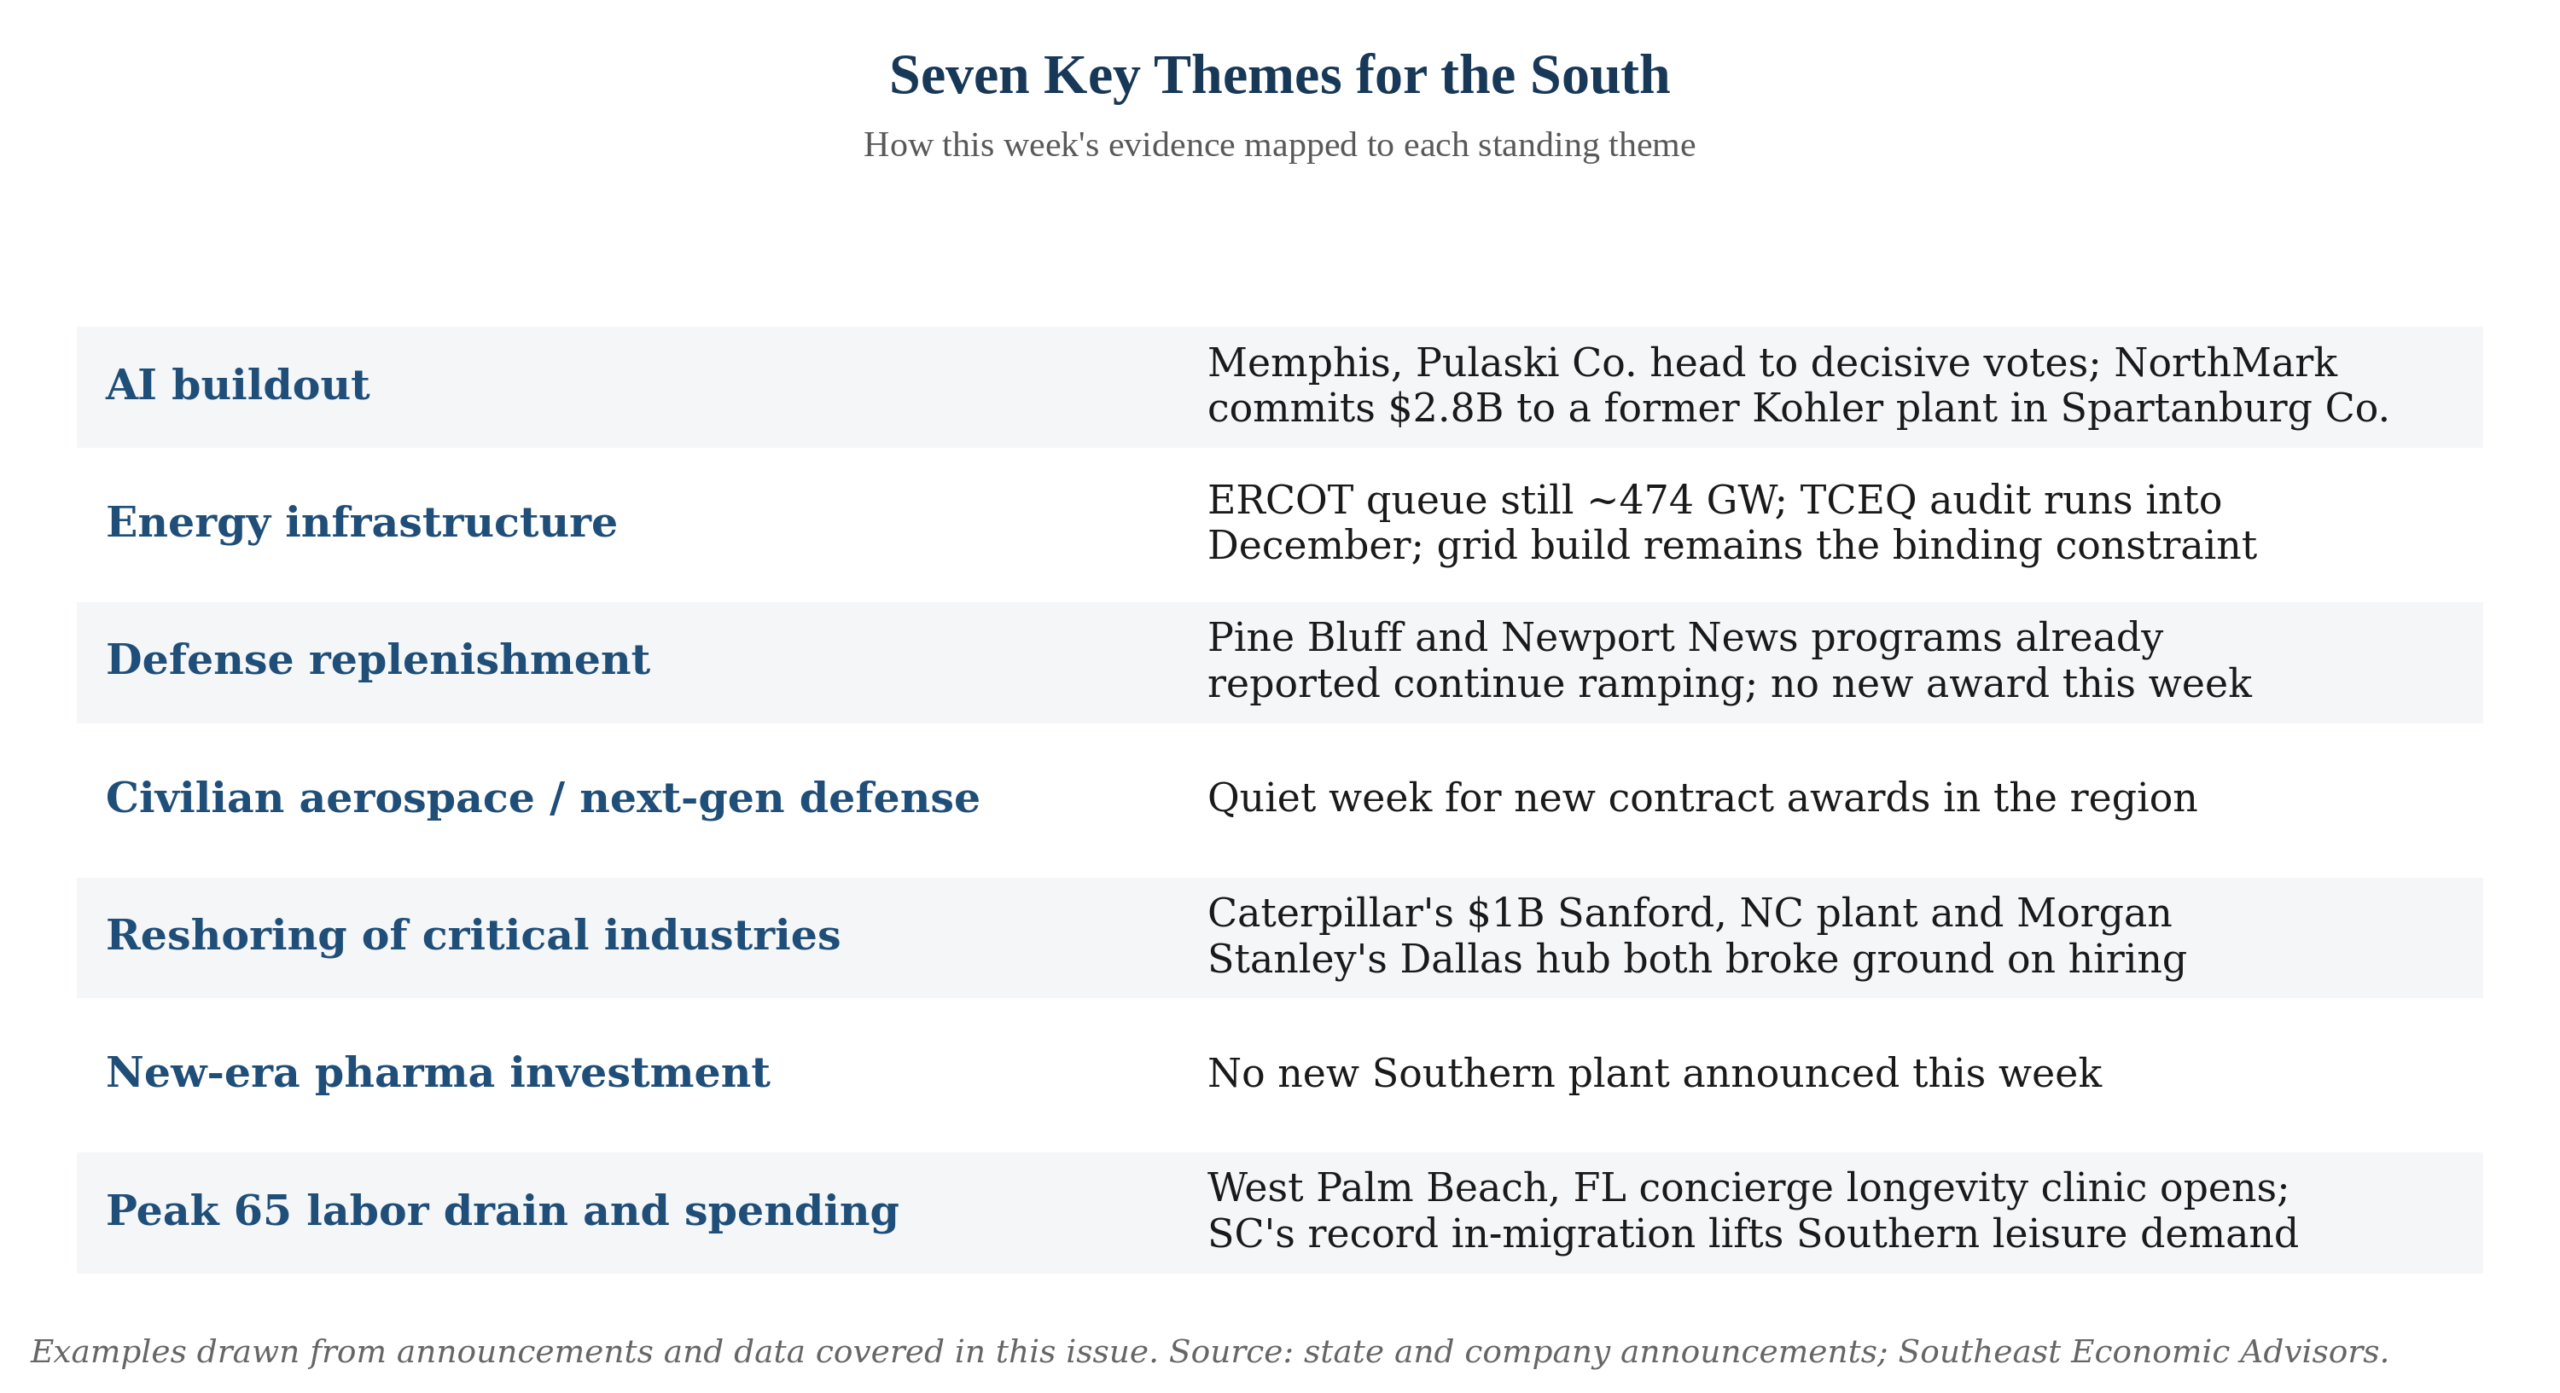
Peak 65 is not only a labor-supply story; it is also a demand-side one. The same wave of retirements pulling experienced workers out of the labor force is lifting travel and leisure spending and out-of-pocket health care spending: concierge medicine, elective longevity care and wellness services that standard insurance does not cover, concentrated in the South’s retirement destinations. Lifespan Edge, a concierge longevity-medicine practice co-founded by John Mauldin and Dr. Michael Roizen, opened a West Palm Beach, Florida location in June offering advanced diagnostics and personalized prevention plans outside the insured-care system. South Carolina, already the nation’s fastest-growing state by population for a second straight year, is seeing that growth concentrated among older arrivals, the same demographic current that shows up as a drain on the labor-supply side above.
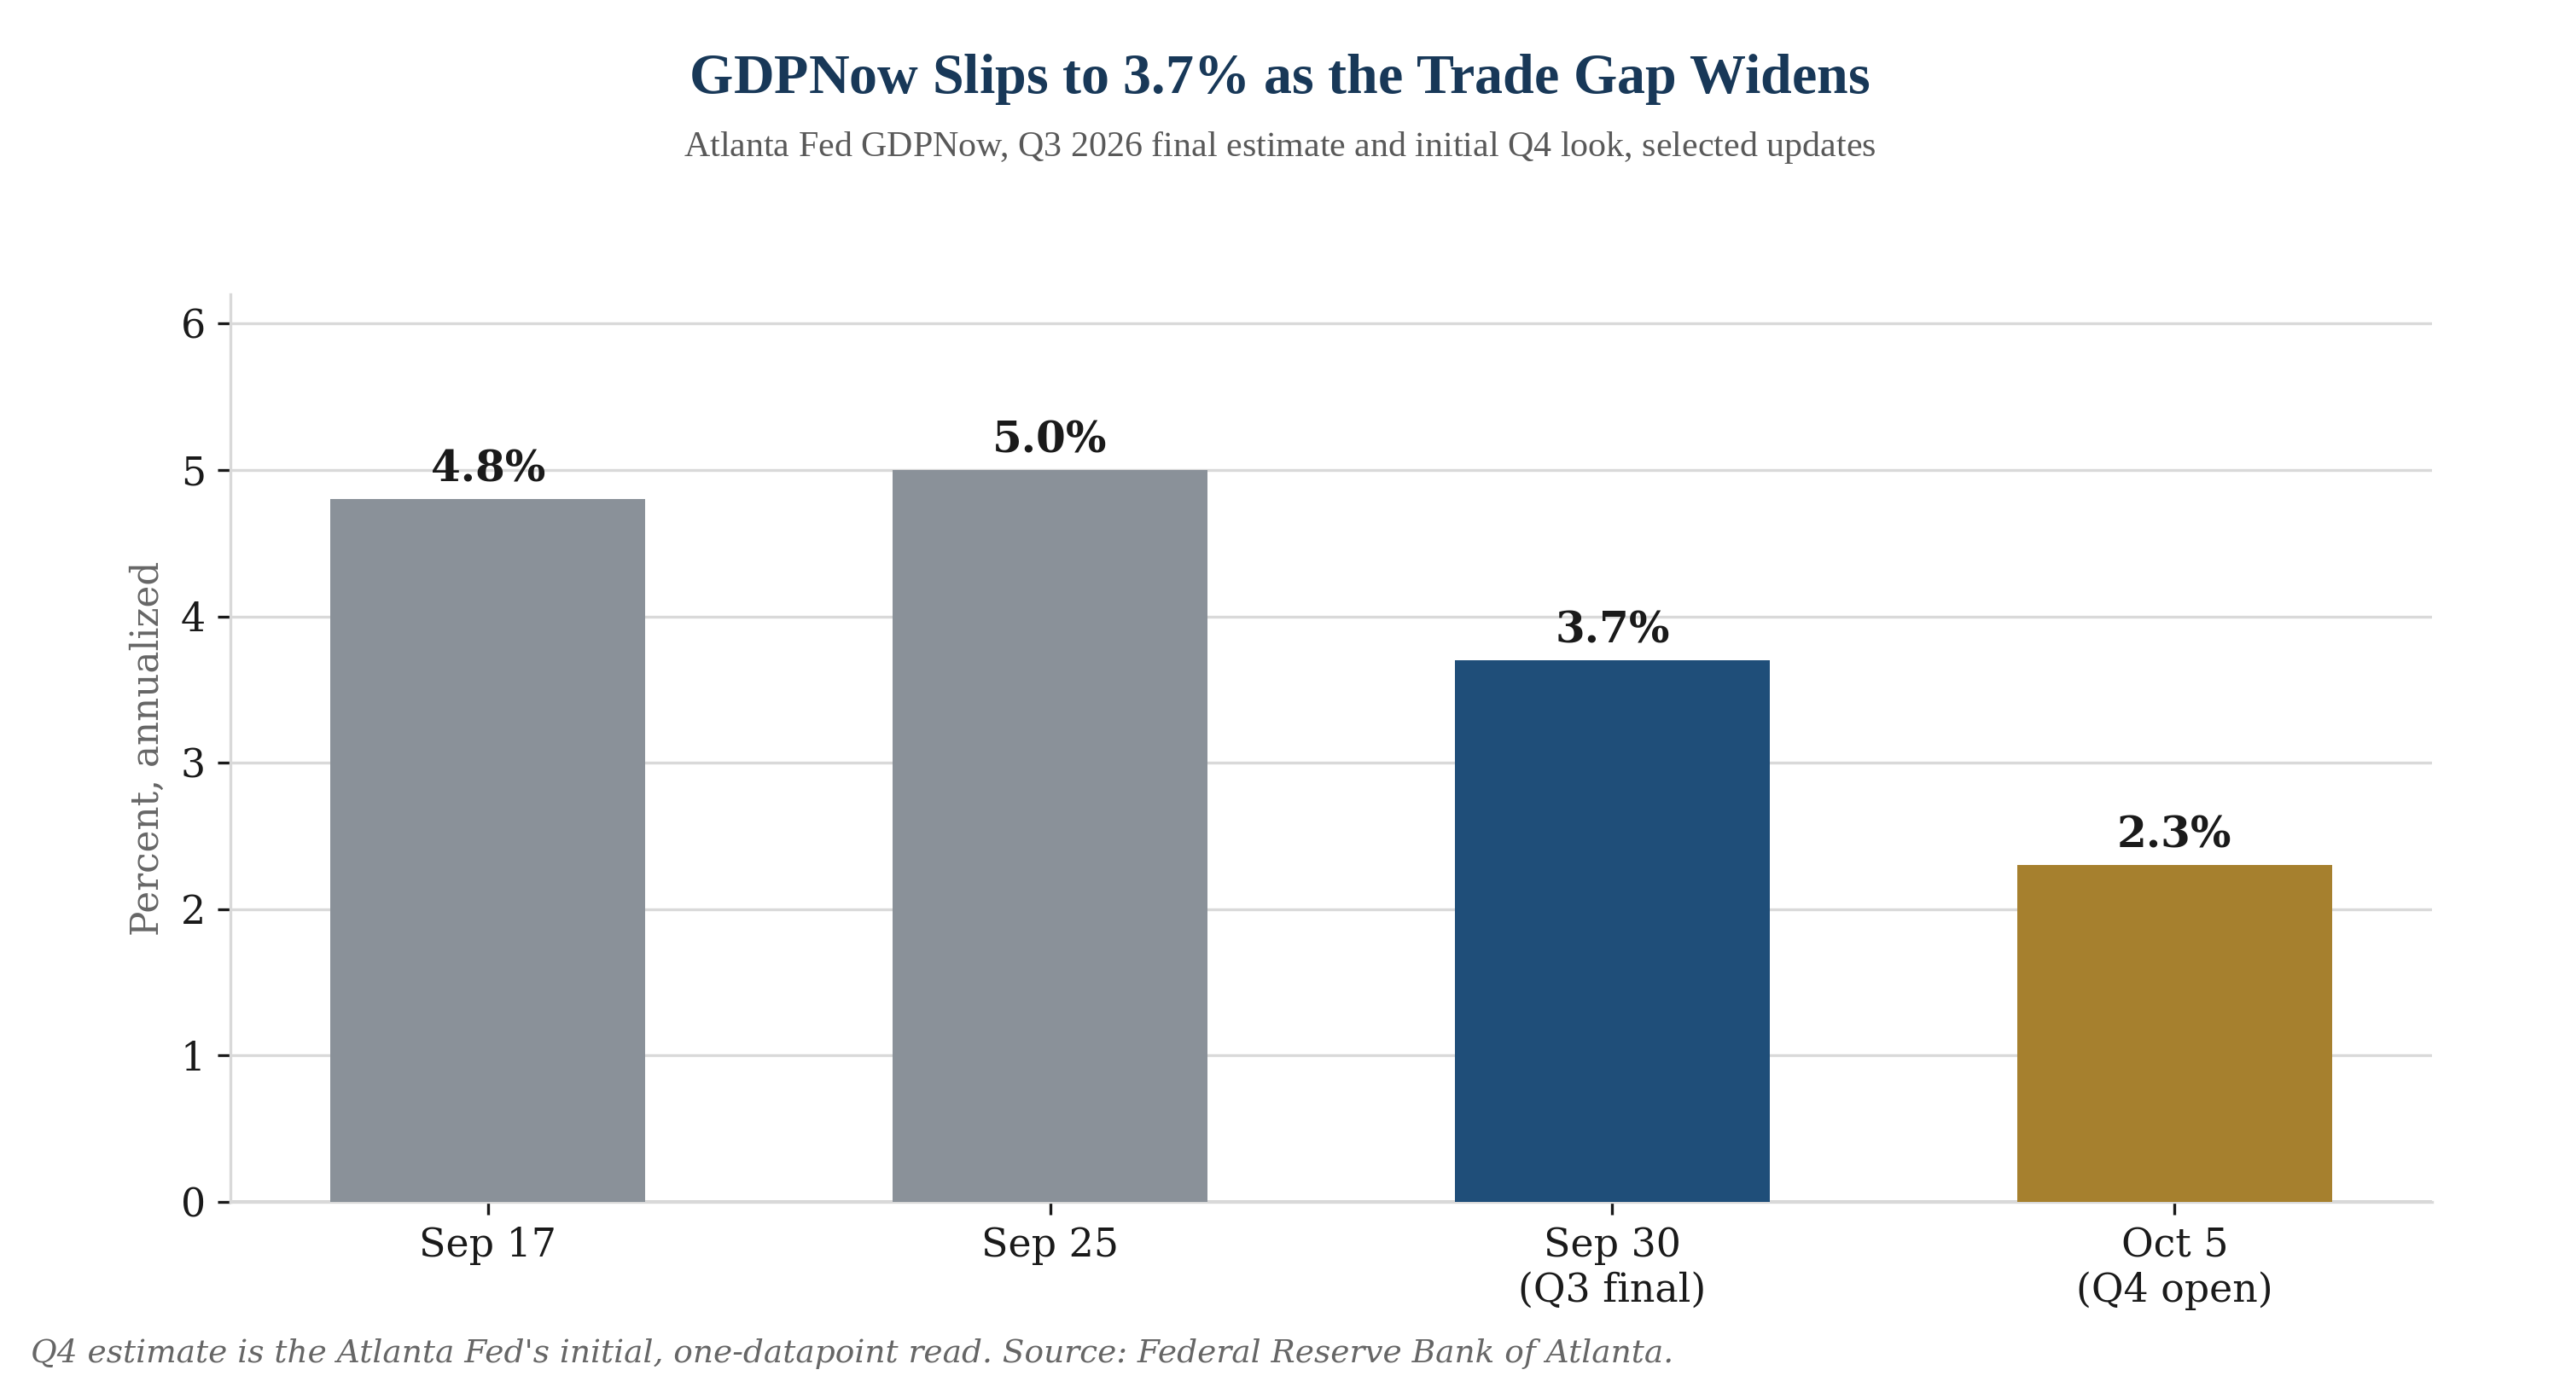
The quarter-to-quarter swing is as much a lesson in composition as in momentum. Consumer spending’s contribution to the Q3 tracking estimate was trimmed to 3.5 percentage points from 4.2, while private investment’s contribution actually rose, to 20.7 points from 18.7, as the goods trade deficit widened to $132.6 billion in August from $115.0 billion expected and $118.9 billion in July. Net exports now subtract an estimated 2.6 percentage points from Q3 growth, nearly double the 1.37-point drag assumed two weeks earlier. The early 2.3% Q4 read is a single data point built before the September jobs report, and we would not lean on it yet; it will move, probably down, once September’s weak payroll print and the softer ISM and confidence readings work their way into the Atlanta Fed’s GDPNow model. That early 2.3% figure is not a house number; our own October 1 call carries full-year 2026 growth at 2.3% as well, with the softer quarters concentrated late in the year, so the two readings point in the same direction even though one is a single quarter and the other is an annual average.
The report the house call was waiting on came in soft. Nonfarm payrolls rose just 29,000 in September, the Bureau of Labor Statistics reported Friday, and employment “changed little” for the month. The unemployment rate ticked up to 4.2%, still within the narrow 4.1% to 4.3% band that has held since March, but the real damage sat in the revisions: July was cut 31,000, to a decline of 10,000, and August was cut 29,000, to a gain of 133,000. Combined, the economy added 60,000 fewer jobs in July and August than first reported, and wage growth held at 3.0% year over year. We said this release would carry the weight to change the Fed’s near-term calculus, and it did.
Markets moved first and fastest. The 10-year Treasury yield, which had pushed to a fresh high near 5.28%, its highest level since 2002, as the long end absorbed a hawkish September dot plot, eased roughly 6 basis points on the jobs report to settle just above 5.2%. The 2s-10s spread sits near 45 basis points and we expect it to steepen further as short rates reprice lower on soft labor data while long rates stay anchored to supply and inflation concerns. Odds of an October 28 hike, which stood near 51% on CME FedWatch the day before the report, collapsed to about 17% by Thursday. Fed Chair Kevin Warsh has held a hawkish line since his August Jackson Hole remarks, and his preferred one more hike this year has not disappeared from the market’s pricing; it has simply moved, with most of the probability now sitting on the December 9 meeting rather than October 28.
The rest of the week’s data describe an economy losing momentum in breadth, not falling off a cliff. Diffusion indexes like ISM’s measure the share of firms reporting growth, not the magnitude of it, and on that basis both factory and services activity are still expanding but with fewer firms pulling the breadth higher. ISM Manufacturing held at 54.5% in September, a tenth below August, with new orders and the order backlog both widening for a ninth straight month even as prices paid jumped nearly seven points to 77.9%, a 24th consecutive monthly increase, with respondents citing tariff-driven input costs and data center demand straining domestic steel supply. ISM Services slipped half a point to 54.9%, still a 27th straight month of expansion, with its employment measure crossing back into expansion after two months below 50 even as price pressures hit their highest reading since July 2022. The Conference Board’s consumer confidence index fell 6.7 points to 81.9% in September, a 12-year low, with the assessment of current business conditions turning negative for the first time since September 2024 and average inflation expectations climbing to 6.1%. JOLTS showed August openings little changed at 7.1 million and quits unchanged at a 1.9% rate, consistent with a labor market where Peak 65 retirements and softer hiring both keep churn low.
The data center fight stayed just as live as the macro story. Memphis’s City Council takes up the third and final reading of its revised 12-month moratorium today, aimed squarely at xAI’s Colossus campus; a rally against the project is planned outside City Hall this afternoon, and the outcome was not yet known as this issue went to print. In Pulaski County, Arkansas, the sponsor of the ordinance County Judge Barry Hyde vetoed in late September has said she will seek the nine votes needed to override him, but no override vote had been scheduled as of this writing. Capital kept arriving regardless: NorthMark Strategies is converting the former Kohler manufacturing plant in Spartanburg County, South Carolina into a $2.8 billion computing center that will generate its own power on site, a reminder that the industry is routing around resistance in some markets even as it draws it in others. We look for the Fed to hold at its October 28 meeting barring a sharp upside surprise in next week’s data; a Beige Book on October 14 that still shows broad-based price pressure, not the jobs report, is what would put a hike back on the table for December.
State Output and Income Across the South
Five Southern states outran the nation’s 2.2% growth pace in the second quarter. The Bureau of Economic Analysis published second-quarter state GDP for all 50 states on September 30: South Carolina led the region at 3.5%, followed by Georgia at 3.1%, Florida at 3.0% and North Carolina at 2.9%. Texas matched the national average exactly at 2.2%, and Mississippi came in just behind it at 2.1%. Oklahoma and Louisiana effectively stalled, at 0.3% and 0.2%, and West Virginia posted the steepest output decline of any state in the nation, down 2.3% at an annual rate. The spread describes a region moving in two directions at once: the Carolinas, Georgia and Florida still carrying real momentum, and Oklahoma, Louisiana and West Virginia sliding toward or into outright contraction.
South Carolina’s GDP growth has a demographic tailwind behind it, and it is a separate Census Bureau figure, not a restatement of the BEA number above. The Census Bureau’s Vintage 2025 population estimates, released in late January, put South Carolina’s population growth at 1.5% for the year ended July 1, 2025, the fastest of any state in the nation for a second straight year; the state added roughly 80,000 residents, overwhelmingly through domestic migration, to reach 5,570,274. That inflow of people is a demand-side driver behind the state’s GDP growth, not a measure of it.
BEA released second-quarter state personal income alongside the GDP figures, on the same September 30 schedule, and the national pattern was broad. Personal income rose in 49 states and the District of Columbia, led by Wisconsin at 6.4%, and fell only in North Dakota, down 4.2% on a mining-sector pullback. The release we have in hand breaks the increase out state by state at the national level but does not isolate Southern states individually in the summary tables available as of this writing; we will carry the region-specific personal income detail in a future issue once BEA’s full state tables are available for closer review. The output side of the ledger, where South Carolina, Georgia, Florida and North Carolina all outran the nation, is the more complete and more timely story this week.
Inflation in the South
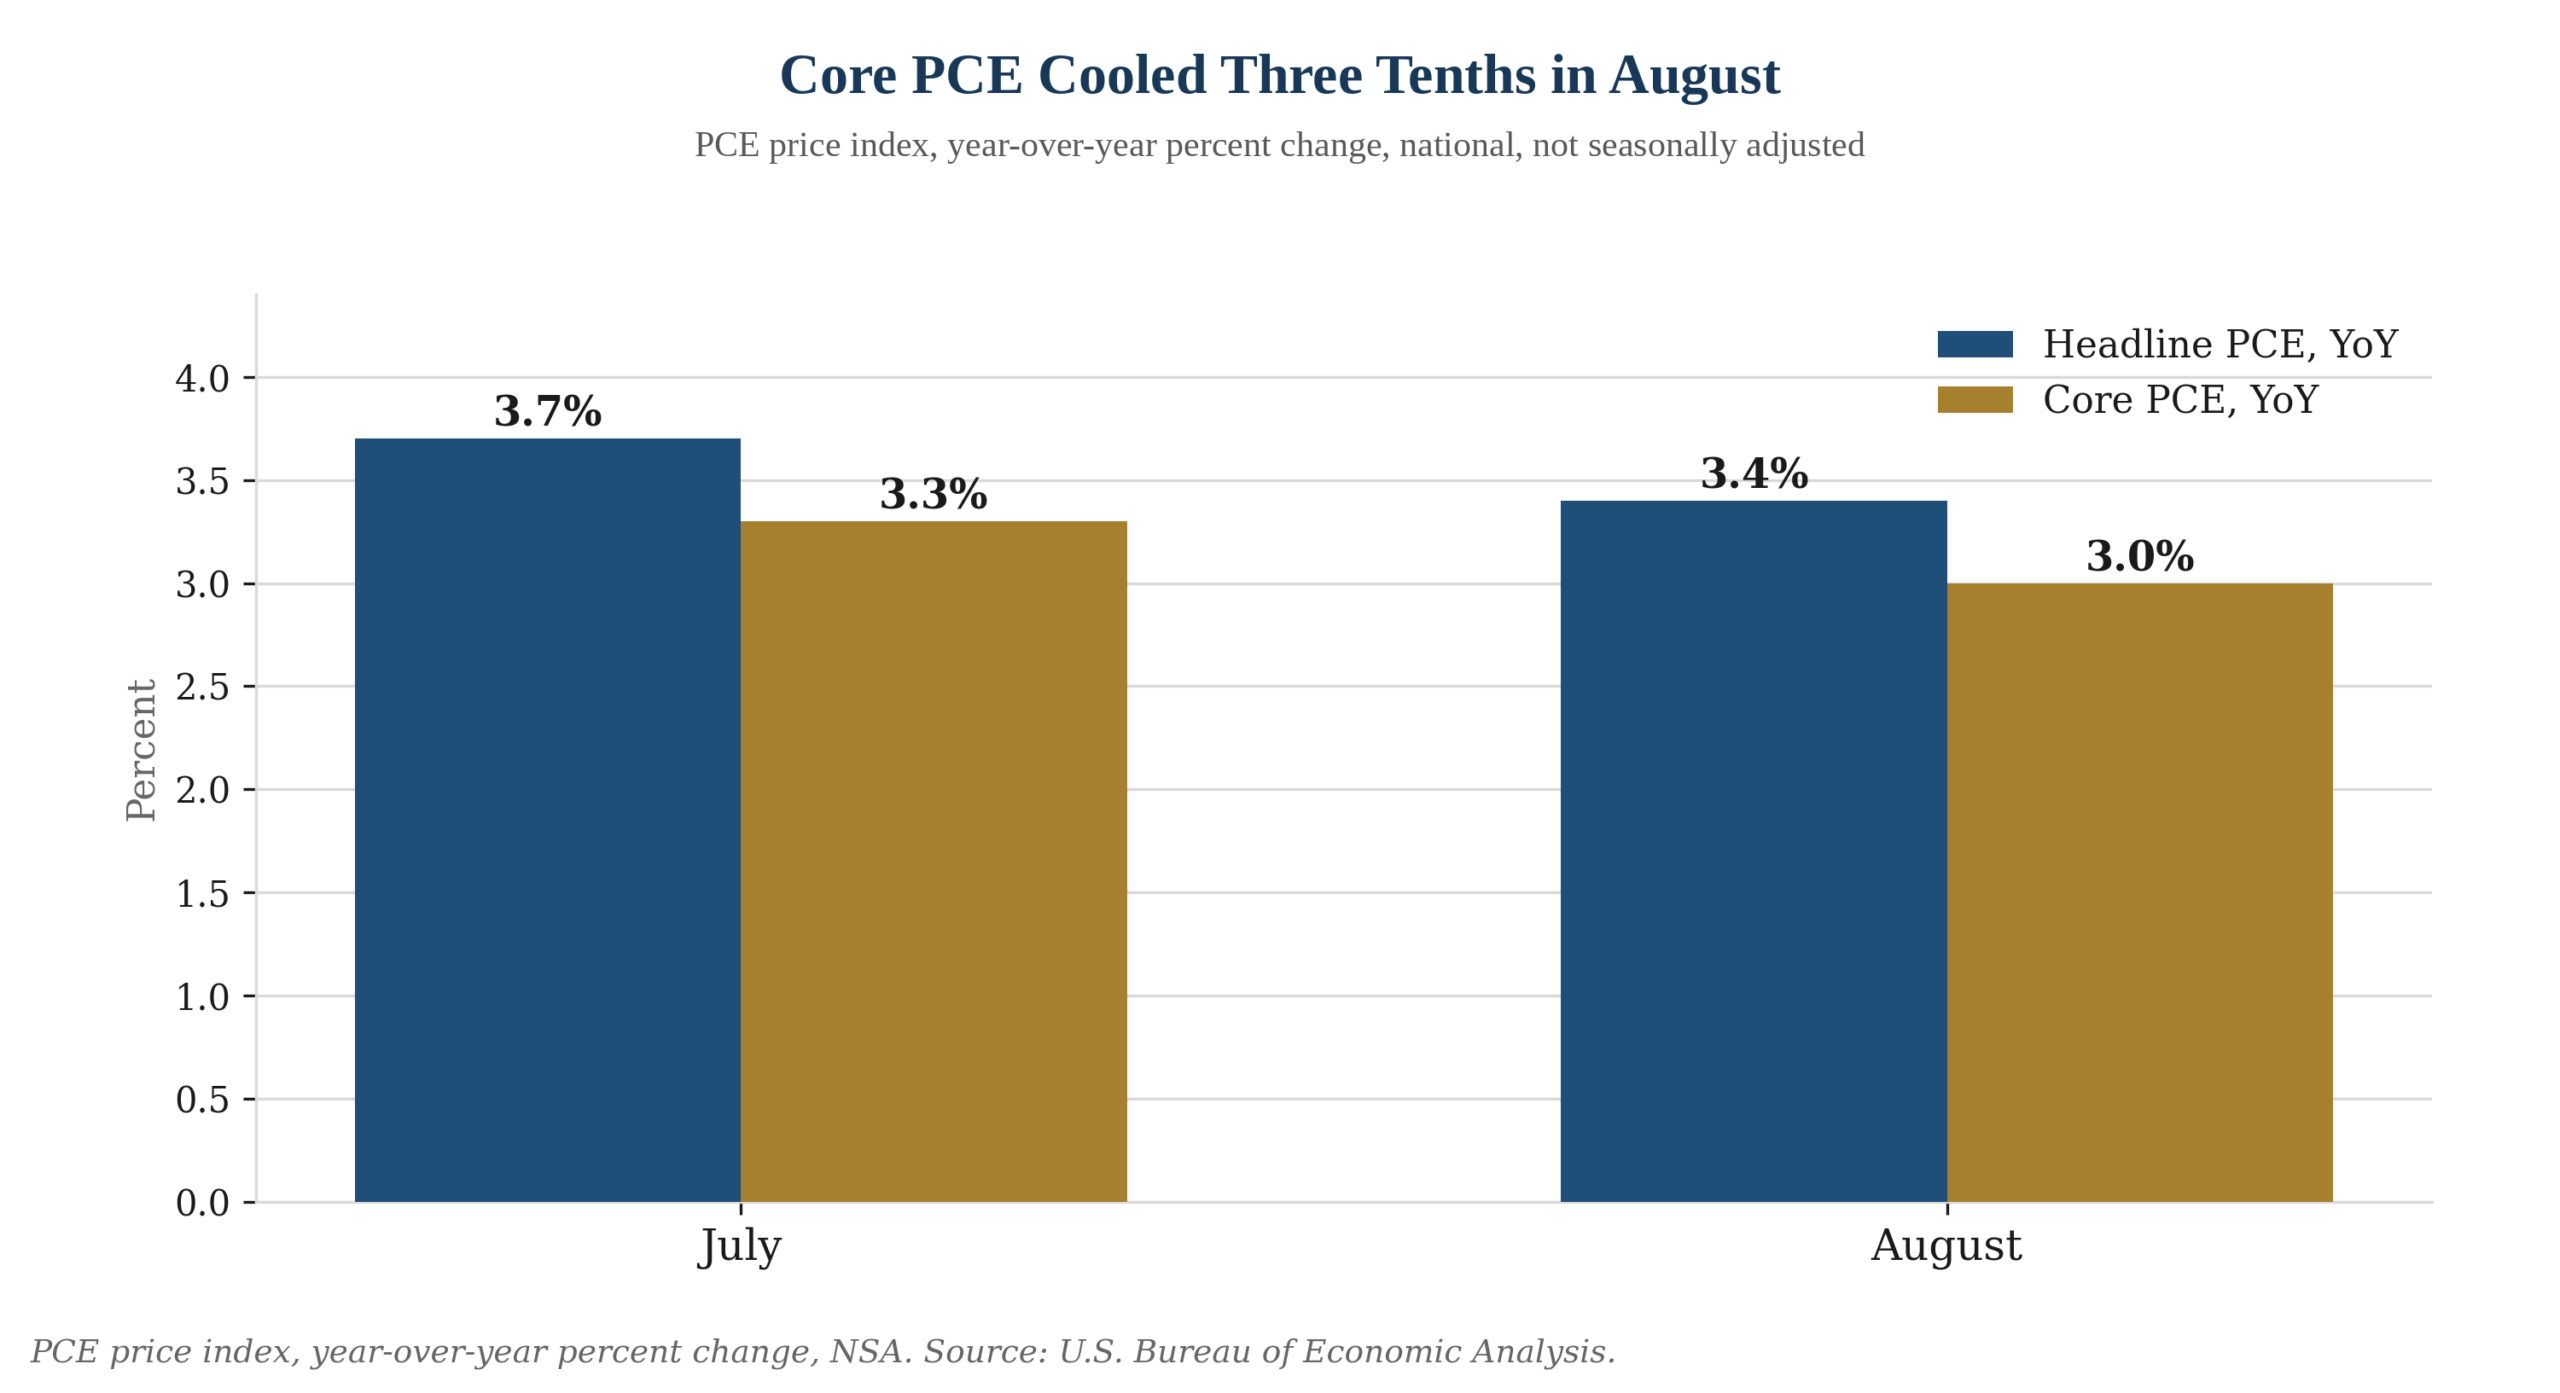
National inflation data posts before the region’s own figures do. August CPI for the South region will not update again until the September report publishes October 14, but the national PCE price index, the Fed’s preferred gauge, showed continued cooling. Headline PCE inflation eased to 3.4% year over year in August from 3.7% in July, and core PCE, which excludes food and energy, slowed to 3.0% from 3.3%. Personal income rose a modest 0.2% on the month while spending jumped 0.9%, pulling the saving rate down to 4.1%. The direction supports the house view that underlying inflation is moderating even as policy stays tight; September’s reading is simply not due yet, a function of the normal reporting calendar and not any lapse in appropriations, and it will be the real test of the trend when it arrives on October 14. Higher diesel and freight costs, which several ISM Services respondents flagged this month, are the clearest channel through which the Brent move could slow that disinflation.
Energy prices are the swing factor working against the disinflation story. December Brent settled at $102.31 a barrel on October 5, down from the $104.32 the November contract fetched on September 25 as the contract rolled, with continued concern over Middle East shipping routes, tanker shortages and higher insurance costs keeping a floor under the price. Gasoline remains the single largest reason the South’s own inflation rate has been running close to the national figure despite the region’s shelter-driven disinflation; we expect the September CPI report to show the South’s energy index still running in the mid-teens year over year.
Labor Markets
Nonfarm payrolls, not the unemployment rate, remain the best real-time read on where an economy stands, and September’s national print was a reminder why. A 29,000 gain alongside 60,000 in combined downward revisions to July and August describes an economy adding jobs at a rate close to stall speed. Nonfarm payrolls rose an average of 51,000 a month over the three months through September, and the unemployment rate averaged 4.1% over that same span even though September’s print rounded up to 4.2%; the two series are not in conflict once Peak 65 retirements and tighter immigration enforcement, which has pulled labor force participation down among foreign-born workers, are put in the frame. A labor force that is barely growing needs far fewer net new jobs each month to hold its unemployment rate steady than a labor force growing at its historical pace, and that is the same demographic drain behind this issue’s broadened Peak 65 theme, not evidence that the recent payroll numbers are somehow less soft than they look. State-level September data for the South will not post until next month, so this week’s regional read leans on August’s report, which showed Texas still leading the region in absolute job gains and South Carolina and Louisiana tied for the fastest percentage growth at 1.6% each.
Kentucky is the state worth watching on its own terms instead of as part of a generic rule. Its jobless rate sits at 4.7%, the highest in the South, and mid-September brought the largest increase in unadjusted weekly jobless claims of any state in the nation, concentrated in manufacturing layoffs tied to the auto supply chain. We read that as a specific, named stress, not as evidence that a rising jobless rate and slowing payrolls move in lockstep across every state; Florida’s rate has drifted up to 4.5% even as its payrolls still grew, just at a much slower 0.6% pace than its recent run, a different story from Kentucky’s layoff-driven increase and one more reason we read each state’s labor market on its own evidence instead of off a single mirrored chart.
National JOLTS data for August round out the picture. Job openings held at 7.1 million, a 4.3% rate, little changed from July’s upwardly revised 7.3 million. Hires ran at 5.2 million, a 3.3% rate, and layoffs and discharges held at 1.6 million, a 1.0% rate; quits held at a 1.9% rate. All four measures were essentially flat on the month, which is consistent with Peak 65 retirements removing experienced workers from the labor force without a matching flow of hiring or job switching behind them, rather than with employers actively cutting staff. Mississippi’s August data illustrate the mechanism directly: its unemployment rate improved to 3.4%, yet labor force participation fell to 54.7%, the lowest since April 2024 and the second-lowest of any state behind West Virginia, with the civilian labor force shrinking even as nonfarm payrolls edged higher. We look for October’s state employment data, when it posts in November, to show the Southern labor market cooling in line with the national pattern instead of diverging from it; a reacceleration in weekly claims above 220,000 sustained for several weeks is what would tell us the slowdown is broadening into layoffs instead of just softer hiring.
BLS metro-area employment data, released the same September 30 morning as the state GDP figures, puts a number on the payrolls-over-rate case at the metro level. Houston carried the highest unemployment rate of any major Southern metro in August, at 5.0%, yet its employers added 44,700 jobs over the year, the largest nominal gain of any metropolitan area in the country; by the rate alone, Houston looks like the region’s weakest labor market, and by payrolls, its strongest. Charlotte paired a 3.7% unemployment rate with a 21,400 job gain over the year, among the larger increases in the Carolinas, while Atlanta’s jobless rate held at 3.4% and Miami matched Charlotte’s 3.7%. Nashville posted the lowest unemployment rate in the region at 3.1%, and Dallas and Washington held at 4.4% and 3.8%. Tampa and Orlando carried the region’s next-highest jobless rates, at 4.7% and 4.6%, without Houston’s offsetting hiring. Houston’s unemployment rate was the highest of any major Southern metro in August, and its payroll growth was the largest of any metro in the country over the same year; the two numbers describe the same labor market, and the second one is the better guide to where it is actually headed.
Policy Watch
The September jobs report shifted the odds on the Fed’s near-term path more than a full week of district bank commentary could have. Odds of an October 28 hike priced on CME FedWatch fell from roughly 51% the day before the report to about 17% by Thursday, with most of the shift landing on the December 9 meeting instead. Fed Chair Kevin Warsh has not backed away from the hawkish stance he took at Jackson Hole in August, and the median dot from the September meeting still shows one more increase this year; the question the market is now asking is one of timing, not direction. We do not wave them off: a single soft jobs report rarely changes a Fed chair’s underlying reaction function, and the Beige Book due October 14 and the September CPI report the same day will carry real weight in deciding whether December stays live.
We checked specifically for any disruption to the federal statistics calendar given this year’s earlier shutdowns, and found none affecting this week’s releases. The two 2026 shutdowns, a four-day lapse in late January and a 76-day Department of Homeland Security-only shutdown that ran into late April, both ended well before this reporting cycle, and the September employment, ISM, JOLTS, GDP and PCE releases all posted on their regular published schedule. The Beige Book’s next edition, due October 14, will be the first new installment since September 2, so the “two-track economy” read from that edition remains the most current description of Fed district conditions.
State and local regulators kept pressing on data center buildout even as capital kept arriving. Beyond the jurisdictions already in our running count, Lovejoy, Georgia and Edgewater, Florida both passed outright bans on new data center construction, Georgetown, Kentucky directed its attorneys to draft a ban ordinance of its own, and Jesup, Georgia moved the other direction, advancing a first reading that would permit data centers as a conditional use ahead of a second reading today. The list of Southern jurisdictions with restrictions in force or pending has grown past what we counted two weeks ago, and we will keep the running tally current as Memphis and Pulaski County resolve their own votes. The Effingham County, Georgia lawsuit over OpenAI’s roughly $20 billion campus west of Savannah, filed in late September by five residents and a coastal nonprofit, remained unresolved as of this writing.
Trade policy showed up this week less as a diplomatic headline than as a cost line in company commentary. Respondents to both ISM surveys cited tariffs repeatedly: manufacturers pointed to “challenges” sourcing semiconductors and electronics under the current tariff schedule and to sharply higher costs on Canadian capital equipment, while several service firms cited the high cost of diesel fuel and said shipping containers from overseas now cost roughly double what they did previously. None of that is new policy, but it is a reminder that the tariff regime is still working its way through Southern manufacturers’ and shippers’ cost structures well after the headlines that first announced it, and it helps explain why factory prices paid rose to a 24-month high even as new orders kept expanding.
Washington’s own funding calendar is a nearer-term risk than most of this week’s data. Congress funded the government only through December 11 with the continuing resolution it passed in August, timed deliberately to avoid a shutdown fight before the November midterms. Lawmakers return for a lame-duck session in November with that deadline still unresolved, and a December funding fight landing in the same window as the Fed’s December 9 meeting would complicate both the data calendar and the policy debate at once. We checked this week’s releases specifically for shutdown-related disruption and found none, a distinction worth drawing clearly from the risk that a new lapse could still delay the data due out in December.
Commercial Real Estate Across the South
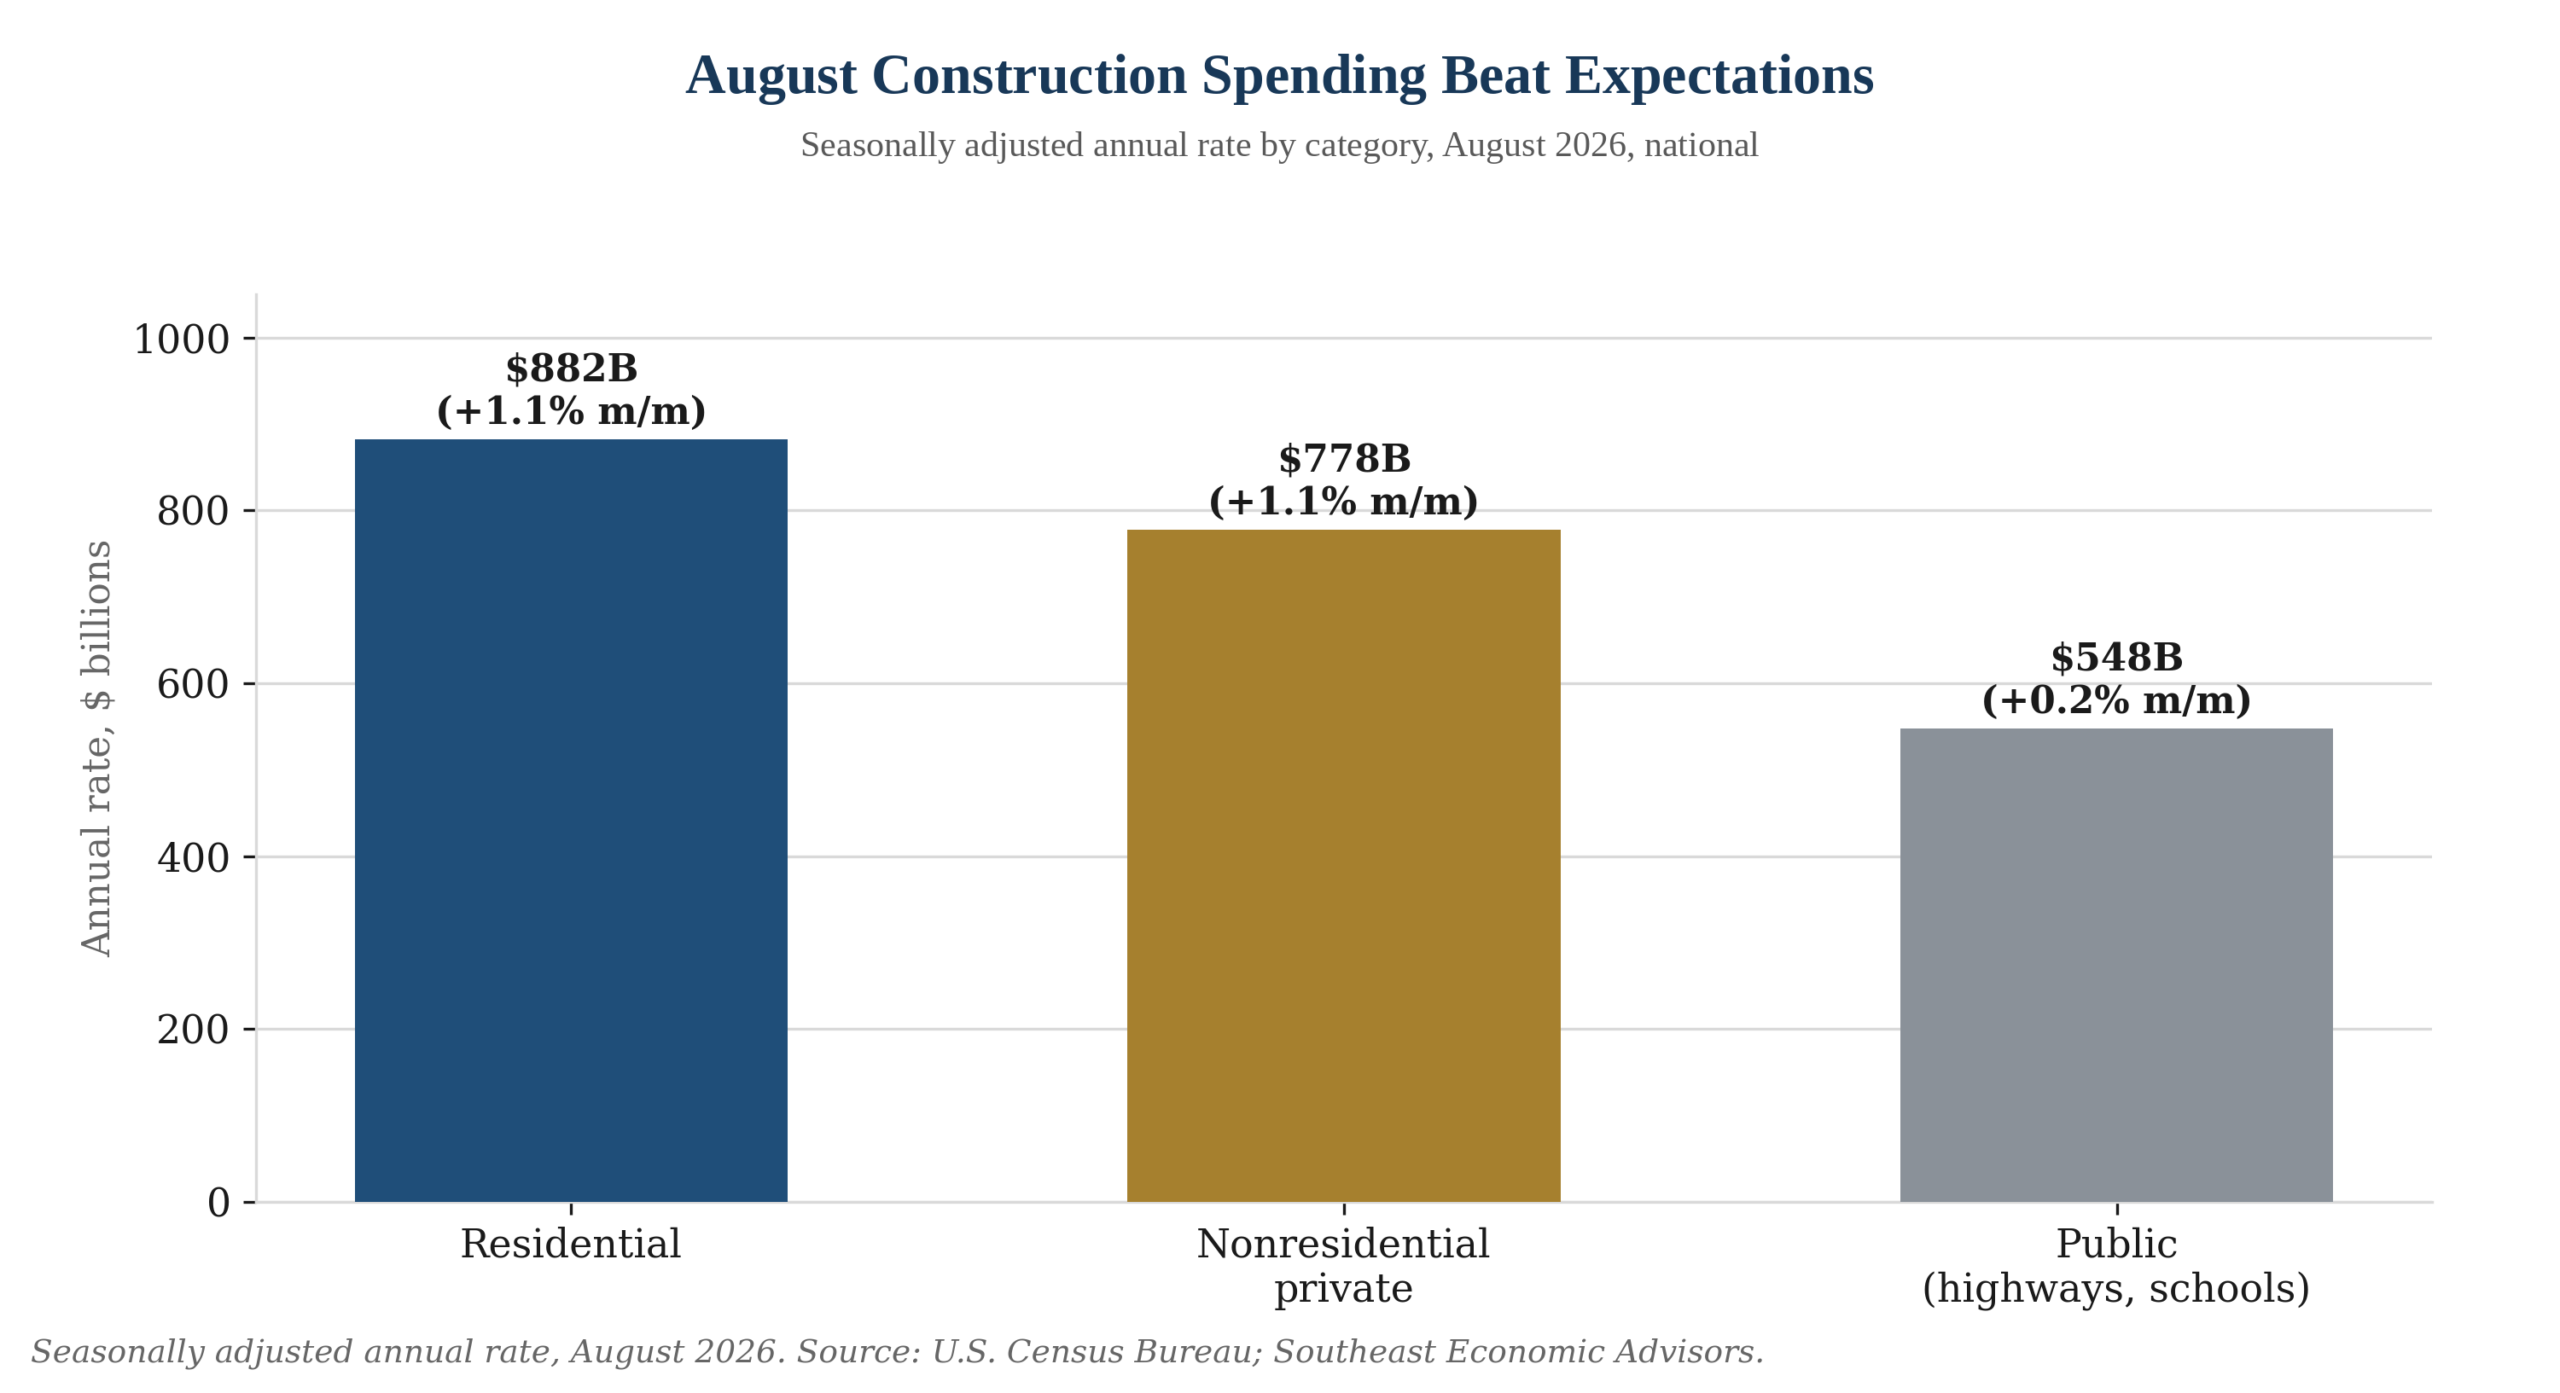
Housing. National construction spending rose 0.9% in August to a $2.2 trillion annual rate, well above the 0.1% gain the consensus expected. Private residential spending led the increase, up 1.1% to an $882.3 billion rate, while public spending on highways and schools rose a slower 0.2%. The gain is a national figure rather than a Southern one, but it is the most current construction data available this week and it points the same direction as the region’s own home improvement and new-construction signals: builders are still spending, even with mortgage rates elevated and the 10-year near a two-decade high.
Multifamily. No new monthly apartment data published this week; the August figures carried in our last issue, with the South the only region still seeing rents fall on net, remain the most current read. We will have September CoStar and RealPage figures for next week’s issue.
Industrial. Second-quarter vacancy and leasing figures stand, with national vacancy at 6.9% and the primary-market data center subset at a record-low 1.4%; no new quarterly brokerage data is due until mid-October, though the steel-cost pressure showing up in this month’s ISM report is a leading indicator worth watching for industrial construction costs in the next release.
Office. Same story: the post-pandemic leasing high and Atlanta’s 26.4% vacancy against a record $33.52 per square foot trophy asking rent both carry forward from the second quarter, with nothing new to report this week beyond the continued split between scarce top-quality space and a still-heavy overall vacancy rate. With the labor force growing slowly, companies are still spending to house their workers in well-located, trophy buildings. This trend is encouraging given all the concerns that AI is going to wipe out office jobs.
Retail. Availability and asking rent figures are likewise unchanged from the second-quarter data already reported.
Capital markets. Transaction volume figures are quarterly and will next update in mid-October with third-quarter totals. The 10-year’s move into the low 5.2% range since our last issue is the more immediately relevant capital markets development: cap rates held roughly flat through mid-year against a 10-year near 4.7%, and that gap has now compressed by nearly 50 basis points without a corresponding move in asking rents. We expect that gap to be the main capital markets story of the fourth quarter, well before the $113.7 billion second-quarter transaction total already reported updates again.
Development Wins of the Week
Carolinas. Caterpillar will invest nearly $1 billion in a new plant in Sanford, North Carolina to build compact track loaders and telehandlers for construction, landscaping, agricultural and material handling customers (September 30); the company has not yet disclosed a jobs figure. In Anderson County, South Carolina, Adeptus USA will spend $216 million reviving a shuttered textile plant (September 30). And in Spartanburg County, NorthMark Strategies will invest $2.8 billion converting the former Kohler manufacturing plant into a computing center that generates its own power on site, adding 27 permanent jobs plus hundreds during the remodeling phase, at what officials describe as zero cost to taxpayers.
Georgia & Florida. Mayville Engineering will invest $26 million and add about 140 jobs at a new metal fabrication facility in Thomson, Georgia, reinforcing the state’s manufacturing supply chain (October 1). Keter, the British-founded maker of outdoor sheds, garden boxes and home products, will locate its North American headquarters and a showroom in Alpharetta, in metro Atlanta; the company has not disclosed investment or jobs figures.
Alabama, Mississippi & Louisiana. A quiet week for headline project announcements in the three states after a strong run that already included Eli Lilly’s Houston-area API plant, the Hanwha Defense munitions campus at Pine Bluff and Applied Digital’s Tuscaloosa County data center, all reported in prior issues. Mississippi Development Authority Director Bill Cork stepped down this week after nearly three years overseeing a stretch that attracted more than $65 billion in investment, mostly data centers, and 23,000 jobs; Governor Tate Reeves called it a retirement, and deputy director P.J. Waldrop takes over on an interim basis.
Tennessee & Kentucky. Also a quiet week for new project announcements; Kentucky’s news this week was labor-market stress rather than investment, with the state posting the nation’s largest mid-September rise in unadjusted jobless claims, concentrated in manufacturing layoffs.
Texas, Oklahoma & Arkansas. Governor Greg Abbott announced Morgan Stanley will build a new regional hub on Dallas’s “Y’all Street” corridor targeting roughly 3,800 jobs (October 1), one of the largest single job-count announcements the state has logged this year. In Pulaski County, Arkansas, the data center ordinance fight continued, with the sponsor of the vetoed measure seeking the votes to override County Judge Barry Hyde.
Virginia, Maryland & DC. LG Electronics will invest $63.9 million in its first U.S. chiller manufacturing plant, at the Shirley T. Holland Intermodal Park in Isle of Wight County, Virginia, creating 164 jobs with production set to begin in early 2027 (October 1). Governor Abigail Spanberger announced the project, the state’s latest win in HVAC and building-equipment manufacturing and a rare bright spot for a Hampton Roads economy that has otherwise been watching Washington-area job losses more than winning new plants.
Key Economic Variables and Events
- Tue., Sept. 29 JOLTS job openings, August (released): openings little changed at 7.1 million.
- Wed., Sept. 30 Second-quarter GDP, third estimate (released): revised up to 2.2%; GDPNow Q3 final cut to 3.7% on a wider trade deficit.
- Wed., Sept. 30 Personal income and outlays, including August PCE inflation (released): headline PCE 3.4% year over year, core 3.0%.
- Wed., Sept. 30 State GDP and personal income, second quarter (released): South Carolina led the South at 3.5%; West Virginia posted the nation’s steepest decline, -2.3%.
- Wed., Sept. 30 Metropolitan area employment and unemployment, August (released): Houston’s 5.0% rate paired with the largest nominal metro job gain in the country, +44,700 over the year.
- Thu., Oct. 1 ISM Manufacturing, September (released): 54.5%. Construction spending, August (released): +0.9% to a $2.2 trillion annual rate.
- Fri., Oct. 2 Employment Situation, September (released): nonfarm payrolls +29,000; unemployment rate 4.2%; July and August revised down a combined 60,000.
- Mon., Oct. 5 ISM Services, September (released): 54.9%.
- Tue., Oct. 6 Memphis City Council, third and final reading on its data center moratorium; Pulaski County, Arkansas, override vote remains unscheduled.
- Wed., Oct. 14 CPI, September, 8:30 a.m.; Beige Book, 2:00 p.m., the first edition since September 2.
- Sun., Oct. 25 Brazil’s presidential runoff: Flávio Bolsonaro faces Lula after leading the October 4 first round. A Bolsonaro win would matter for U.S.-Brazil trade and for Southern soybean growers already competing with Brazilian supply amid the tariff pressure showing up in this month’s ISM commentary.
- Tue.-Wed., Oct. 27-28 FOMC meeting, with the press conference October 28; markets now assign this meeting only about a 17% chance of a hike.
- Tue., Nov. 3 U.S. midterm elections, which will decide control of Congress and carry real weight for the fiscal and regulatory outlook heading into 2027.
- Wed., Dec. 9 FOMC meeting; markets have moved most of the probability of a fourth 2026 hike to this date.
- Fri., Dec. 11 Government funding deadline; the August continuing resolution expires, with Congress back from its lame-duck recess to address it.
Recent Research
“The South Is Adding Residents Faster Than Income” leads the research page this week. The October 1 report’s falsifiable test is the one to watch when third-quarter state personal income data post in December: Southern per-person income growth running about 0.8 points behind the rest of the country even as the region’s population grows faster than it does. The seventh annual Economics of College Football series continues with weekly game previews through the season; all of it posts at southeasteconomy.com. Tennessee beat Auburn 24-14 on October 3 in the Week Five matchup we previewed in our last issue. This week the series turns to the Red River Rivalry, Texas and Oklahoma in Dallas, and the compelling economic stories playing out in both states.
Mark Vitner
Chief Economist, Piedmont Crescent Capital / Southeast Economic Advisors
southeasteconomy.com
Sources & Notes
Sources: U.S. Bureau of Labor Statistics; U.S. Bureau of Economic Analysis; U.S. Department of Labor; Federal Reserve Board; Federal Reserve Bank of Atlanta (GDPNow); CME Group; U.S. Census Bureau; U.S. Energy Information Administration; U.S. Treasury; CME FedWatch; state commerce and economic development agencies; company and local government announcements; Memphis City Council; Pulaski County, Arkansas Quorum Court. State GDP and personal income are BEA’s second-quarter 2026 releases of September 30; metropolitan area employment and unemployment are BLS’s August 2026 release of the same date (USDL-26-1548); South Carolina’s population growth figure is the Census Bureau’s Vintage 2025 population estimates, released in late January 2026.
Notes: September payroll, unemployment and wage figures are the BLS Employment Situation released October 2, preliminary and subject to revision; July and August figures are as revised in that same release. PCE figures are for August 2026, the latest available; South-region CPI will next update with the September report on October 14. ISM figures are diffusion indexes, measuring the share of firms reporting expansion rather than the size of any expansion or contraction, and are not seasonally comparable to payroll counts. State-level Southern labor data are August 2026, the latest available; September state detail posts in November. State GDP and personal income are for the second quarter of 2026, the latest available; third-quarter state figures are not due until December. BEA’s September 30 release did not break out personal income by state in the summary tables available as of this writing; we will carry Southern state-level personal income detail once BEA’s full state tables are available. Metropolitan area employment and unemployment are for August 2026, the latest available, on the same roughly one-month lag as state data; September metro detail is not due until early November. CRE figures without a new release this week are the second-quarter 2026 data already reported in our prior issue. Market levels are as of the October 5 close. We checked specifically for government-shutdown-related disruption to this week’s federal data releases and found none; the two 2026 shutdowns had both ended by April 30. We define the South as every state that competes in the Southeastern Conference along with the South Atlantic states, extending up to Maryland and West Virginia.