Raleigh-Durham Mid-Year Economic Outlook
The nation’s research and talent engine enters the second half of the decade in championship form
| Outlook | GDP Growth | Employment | Migration | Investment |
|---|---|---|---|---|
| POSITIVE ▲ | +3.0% ’26–’30 | +15,400 (Raleigh–Cary, CES, Apr ’26) | ~35,000 (2026F) | $8B+ life sciences |
Executive Summary
The Carolina Hurricanes return to the Stanley Cup Final this week for the first time since they won it in 2006. The region they call home has traveled a similar arc: two decades of patient building, and now a national contender in its own right.
The region’s edge rests on three research universities, the largest research park in the country, and one of the deepest pools of scientific and technical talent anywhere. With the national expansion increasingly driven by capital investment and applied research, those assets should let the Triangle outpace the country. The Raleigh–Cary MSA added 15,400 jobs over the year ending April 2026, a 2.0 percent gain and the largest of any large metropolitan area in the nation, and the region’s life sciences cluster drew the largest share of nearly $4 billion in statewide investment committed in 2025.
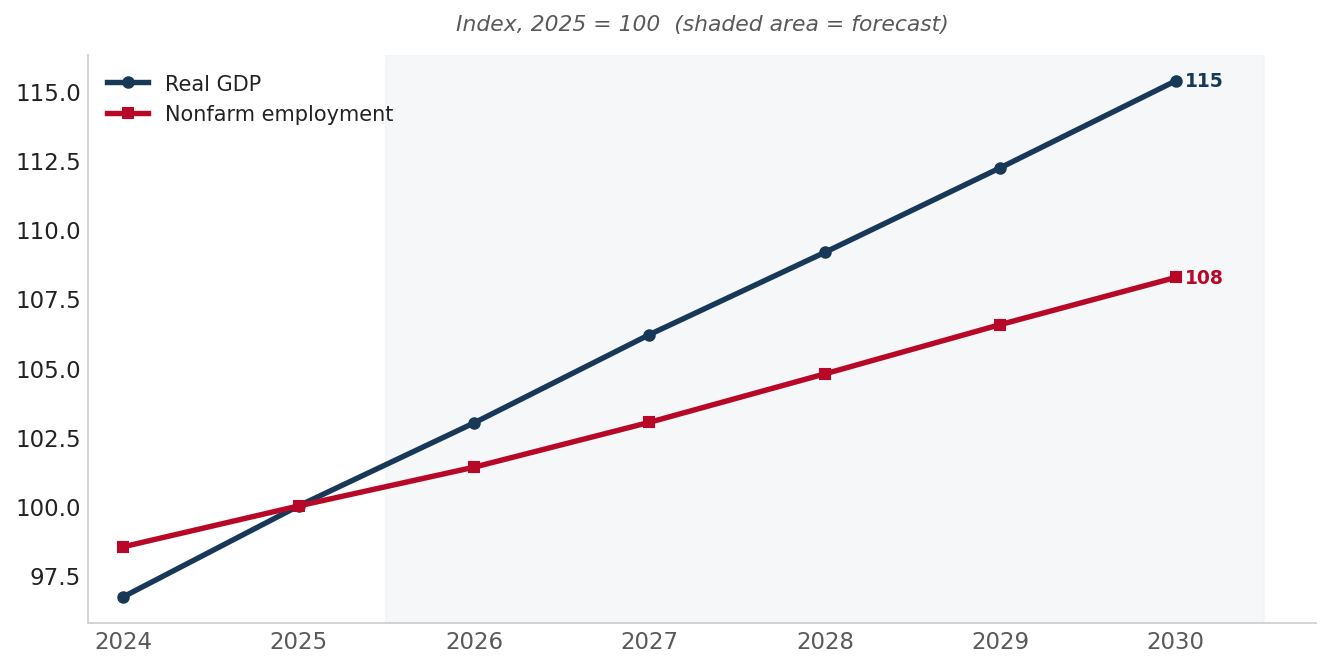
Our base case calls for Research Triangle real GDP growth of about 3.0 percent a year through 2030, comfortably above the projected 2.3 percent U.S. pace, with employment re-accelerating as announced investments are built out and convert to permanent hiring. The risks here are distinctive. Deep cuts to federal research funding strike directly at the academic-research engine, and housing affordability and an underbuilt transit network are the most-cited domestic concerns. Set against those risks is a base that few metros can match: the universities, the talent pipeline, and a diversified mix of life sciences, technology, health care, and government.
Key Takeaways
- Raleigh–Cary added 15,400 net new jobs (2.0% y-o-y gain) over the year ending April 2026, the largest gain of any large U.S. metropolitan area, according to the latest CES data. The Raleigh MSA unemployment rate fell to 3.0 percent, the lowest in North Carolina.
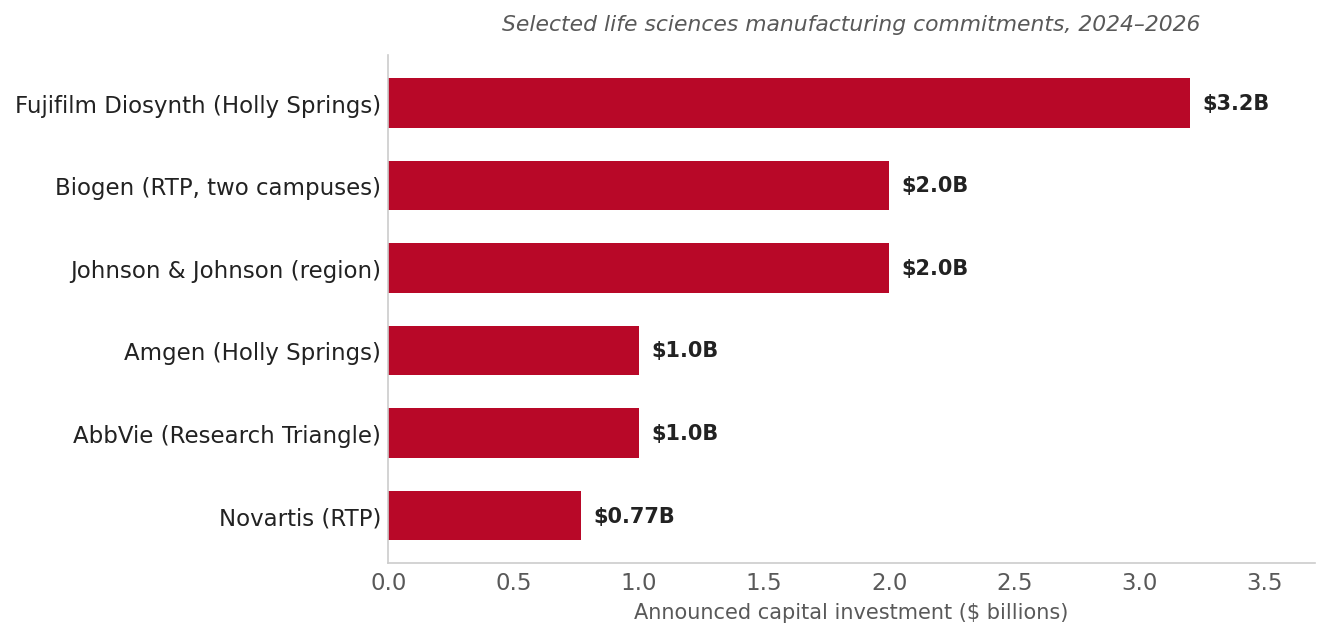
- Life sciences led the investment cycle. North Carolina booked roughly $3.8 billion across eighteen life sciences projects in 2025, concentrated in the Triangle: Biogen ($2B, RTP), Novartis ($771M, RTP), and AbbVie ($1B+ new Research Triangle campus), alongside earlier commitments from Fujifilm Diosynth ($3.2B), Amgen ($1B), and Johnson & Johnson ($2B) in and around Holly Springs.
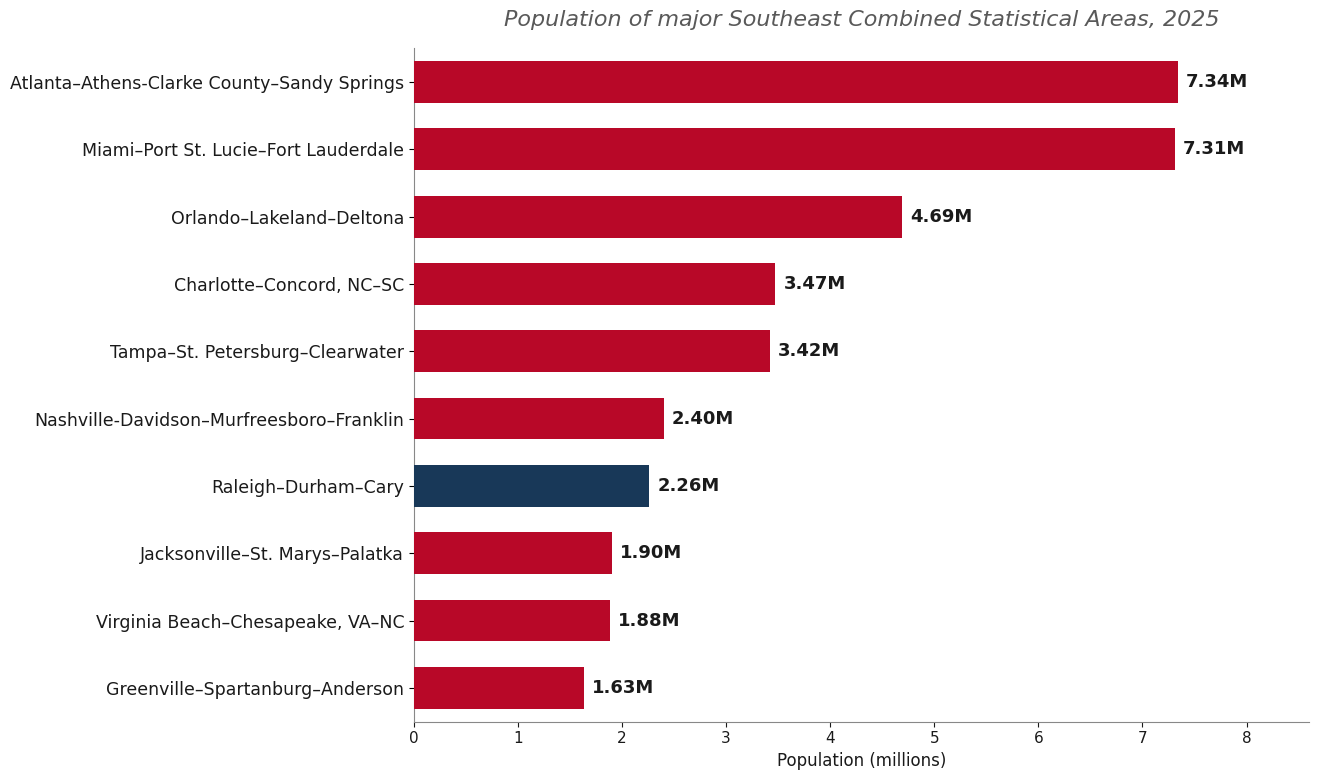
- The region is best understood as a Combined Statistical Area. Research Triangle Park sits in no single city, and the economy functions as one integrated labor market spanning Raleigh, Durham, Chapel Hill, and Cary. The CSA’s roughly 2.3 million residents make it the second-largest in North Carolina, behind only Charlotte.
- Universities, health systems, and government anchor the base. Duke University and Duke Health together form the region’s largest private employer, and because Raleigh is the state capital, the Triangle pairs large public and private universities (Duke, UNC–Chapel Hill, NC State) and major health systems (Duke Health, UNC Health, WakeMed) with a substantial state-government workforce, a stabilizing core that few Sun Belt peers possess.
- Housing has cooled to a more balanced footing. The median home price in Raleigh sits near $420,000, with inventory up sharply and price growth essentially flat, a welcome reset after several years of rapid appreciation. Affordability, particularly for longtime residents, remains the most-cited long-term risk.
- The principal risk is federal. Cuts to NIH and research funding strike directly at the Triangle’s research engine, leaving its universities and RTP companies unusually exposed. Tech-sector concentration, with Apple’s RTP campus still paused, and a transit network on the drawing board round out the watch list.
Why the Triangle Is a Combined Statistical Area
The Research Triangle is not a single city ringed by suburbs. It is a polycentric region with several distinct centers. Raleigh is the state capital and the area’s largest city, a government and technology hub that crossed 500,000 residents in 2024. Durham is home to Duke University and a fast-growing biotechnology sector and downtown. Chapel Hill anchors the University of North Carolina. Cary has become a major corporate and residential center in its own right, home to SAS Institute, Epic Games, and a growing roster of headquarters operations. At the geographic center sits Research Triangle Park, 7,000 acres that belong to no municipality at all, located mostly in Durham County with a significant portion in Wake.
Federal statistics have split this single economy into two metropolitan areas for at least the past twenty years. The CSA is comprised of Raleigh–Cary and Durham–Chapel Hill, plus the Henderson micropolitan area to the north. But residents have long regarded the Triangle as one market, and they do not live their lives inside those lines. A scientist may live in Chapel Hill, work in Research Triangle Park, and see a specialist at a Raleigh hospital, crossing two metro boundaries before lunch. The Combined Statistical Area is the only geography that captures the region as it actually functions: a single, integrated labor market and innovation ecosystem of about 2.3 million people across nine counties. That makes it the second largest CSA in North Carolina.
Reading the Triangle at the CSA is the best way to understand the market and is a true reflection of how the region’s economy operates. Viewed as two mid-sized metros, the region looks ordinary. Viewed as one, it is among the country’s leading knowledge economies. The chart below places it among its Southeast peers on a consistent Combined Statistical Area basis.
A Knowledge Economy Anchored by Universities and Research
The region’s defining asset is its concentration of research universities and the talent they produce. Duke University and Duke Health together form the Triangle’s largest private employer, while the University of North Carolina at Chapel Hill, the nation’s oldest public university, and North Carolina State University round out a trio that anchors both the labor force and the innovation pipeline. More than 200,000 students are enrolled across the region’s universities and public school systems, and the metro consistently ranks among the most highly educated in the country.
These institutions are economic engines, not just educators. Duke alone accounts for billions in annual wages paid to North Carolina residents, and Triangle universities and health systems feature prominently on national best-employer rankings. Steady demand from higher education and health care gives the regional economy a stability that purely cyclical Sun Belt metros lack.
At the center sits Research Triangle Park, at 7,000 acres the largest research park in the United States, home to more than 300 companies and over 50,000 workers. The next-largest U.S. research park, Cummings Research Park in Huntsville, Alabama, covers fewer than 4,000 acres. RTP gave the region its name and its founding model: place corporate research and development alongside university research. The Research Triangle Foundation recently cleared the final hurdle on a rezoning that will allow a denser, mixed-use Hub RTP district, modernizing a campus built for a different era.
The technology base is deep. IBM operates one of its largest campuses here; Red Hat, now part of IBM, and Cary-based SAS Institute are homegrown software leaders; and Lenovo runs its U.S. headquarters in Morrisville and lends its name to the Raleigh arena where the Hurricanes play. Cisco, NetApp, Fidelity Investments, Epic Games, and Wolfspeed add further depth, while Google runs an engineering hub in Durham and Microsoft continues to add positions.
The one cautionary note in the technology story is Apple. The company’s 2021 commitment to a $1 billion, 3,000-job RTP campus, backed by up to $845 million in state payroll-tax incentives through 2061, remains paused, with construction suspended for up to four years even as Apple continues to lease space and add staff, reaching roughly 1,630 employees statewide. The episode shows that even marquee tech commitments can shift, and that the region depends less on any single campus than on the universities and the talent they produce.
Apple is not the only high-profile commitment to stumble, and the broader development boom has had real disappointments. In Chatham County, about thirty miles southwest of Raleigh, VinFast’s planned multibillion-dollar electric-vehicle plant, once the largest economic-development announcement in state history at a promised 7,500 jobs, has been repeatedly delayed and largely idle since late 2024. In May 2026 the state sued to reclaim the Moncure megasite after the company missed its construction and hiring deadlines. Nearby in Siler City, Wolfspeed’s $5 billion silicon-carbide semiconductor plant has been slow to ramp, and the Durham-based chipmaker passed through Chapter 11 bankruptcy in 2025 amid a cooling EV market and a heavy debt load. Both setbacks reflect company- and sector-specific troubles rather than any weakness in the Triangle, but they are a reminder that megaprojects carry execution risk, and that the region’s durability comes from its broad base rather than any single marquee win.
The Life Sciences Investment Wave
If information technology gave the Triangle its start, life sciences are driving its current expansion. North Carolina booked nearly $4 billion in life sciences investment in 2025. Eighteen companies announced roughly $3.8 billion and about 1,380 jobs across ten communities, and the large majority landed in the Triangle. Biogen, marking 30 years in the state, accounts for more than half of that total with a $2 billion expansion and modernization of its two RTP campuses. Novartis announced $771 million across its RTP sites, including its first U.S. biologics drug-substance facility, with as many as 700 jobs. And in early 2026, AbbVie unveiled plans for a new Research Triangle campus exceeding $1 billion, with 734 permanent jobs and delivery targeted for late 2028.
These join a run of recent commitments just beyond the Park’s borders. In Holly Springs, on the Wake County side of the region, Fujifilm Diosynth Biotechnologies is building a $3.2 billion cell-culture manufacturing plant and Amgen has committed $1 billion, while Johnson & Johnson has pledged $2 billion to a regional manufacturing campus. The cluster is broadening from research and clinical work into large-scale biomanufacturing, the capital-intensive, high-productivity activity driving this national cycle. The venture base is maturing alongside it. Durham’s Hatteras Venture Partners closed more than $200 million across two funds in 2025, its largest haul in a quarter century, and new seed-stage funds are forming around Duke and UNC spinouts.
Even commercial real estate reflects the shift. Life sciences vacancy across Raleigh–Durham fell from 23.6 percent in early 2025 to 20.9 percent a year later as a glut of speculative lab space is gradually absorbed and developers hold off on new construction. The Triangle now ranks among the top five life sciences hubs in the nation.
Talent, Migration, and Housing
Population growth continues to power the regional economy. The Raleigh–Cary metro has grown about 13 percent since 2020, to nearly 1.6 million, while Durham–Chapel Hill has reached about 625,000. The CSA is slightly broader than just the combination of the two MSAs. The region’s growth is increasingly international as well as domestic. Roughly a third of recent arrivals in the Raleigh metro and three-quarters in the Durham metro were international migrants, reflecting the global pull of the universities and the biopharma cluster. Wake and Durham counties now rank among the most foreign-born in the state.
Housing has finally caught its breath. After several years of double-digit appreciation, the Raleigh market has shifted toward balance. The median sale price sits near $420,000, roughly flat over the past year, with active listings up sharply, homes taking about 45 to 60 days to sell, and a growing share closing below asking. Durham’s median is lower, near $378,000. Mortgage rates in the low-to-mid-6 percent range remain the binding constraint. The National Association of Realtors estimates that a move toward 6 percent would qualify nearly 27,000 additional Raleigh households for a median-priced home. The search for affordable housing options has pushed residents further out into counties just beyond both metro areas.
Affordability is still the region’s most-cited long-term risk. Raleigh’s price-to-income ratio of roughly 5.3 has crept above the level that comfortably fits most household budgets, and regional mobility options remain limited. Housing is still affordable relative to other tech-driven metro areas, it is simply becoming less affordable for natives and long-time residents. A long-planned commuter rail line has yet to be built, and the area remains heavily car-dependent. Sustaining the current growth path will require both continued housing supply and real progress on transit.
Commercial Real Estate
The region’s commercial property markets echo the broader economy: demand underpinned by population growth, life sciences, and a deep employment base, set against the supply that a decade of strong growth invited. The picture varies sharply by property type. Space is scarce where the region is strongest and more plentiful where construction has run ahead of absorption.
Industrial is the clearest illustration of this tension. The Raleigh market spans roughly 110 million square feet, and vacancy has climbed to about 7.8 percent, well above its long-run average of around 4 percent and roughly in line with the national rate, as 2.9 million square feet of new deliveries outpaced 1.6 million square feet of net absorption over the past year. The strain is concentrated in mid-sized buildings, where vacancy runs above 11 percent, while big-box space over 500,000 square feet is nearly full at 1.6 percent. Asking rents have risen about 2.7 percent, to roughly $12.90 a square foot, ahead of the national pace but well off the double-digit growth of 2022. The market’s defining feature is its life sciences and flex base: flex buildings make up about a quarter of inventory, against a tenth nationally, and the RTP/RDU submarket commands the region’s highest industrial rents. Capital has followed. Industrial sales reached roughly $1.6 billion over the trailing year, about triple the 2024 total, led by Fortress Investment Group’s $455 million purchase of the Spark Life Science Campus in RTP, and marquee projects such as Novo Nordisk’s 1.4 million-square-foot Johnston County plant remain under construction.
Office is the region’s softest commercial sector, yet it remains markedly healthier than the national market. Raleigh possesses about 81 million square feet of office space, with 10.8 percent vacant, down from a recent peak of 12.1 percent in early 2025 but still well above the 7.7 percent that prevailed the prior decade. Demand has been positive for three straight quarters, with net absorption of roughly 1.0 million square feet over the past year, comfortably above the market’s long-run average of around 660,000 square feet. Tenants are increasingly trading up to higher-quality, amenity-rich space in mixed-use districts such as North Hills and Raleigh Iron Works. Asking rents rose about 2.9 percent, to roughly $32.55 a square foot, which is below the national average near $37 but ahead of the 1.5 percent national pace, even as richer concessions have pushed effective rents lower. Supply is the market’s saving grace: the construction pipeline has fallen from a 2023 peak near 2.9 million square feet to about 760,000 square feet, roughly 90 percent of it pre-leased or owner-occupied and anchored by Raleigh’s new 362,000-square-foot, seventeen-story city hall downtown, due in early 2027. With little speculative space coming, Raleigh’s vacancy should stay well below the 13.9 percent national office rate and below competitor markets. Sales have begun to recover: volume of roughly $352 million over the trailing year sits below the market’s ten-year average near $866 million, but activity has accelerated sharply, including about $300 million in the first quarter of 2026, the strongest quarter since 2021, at prices averaging near $177 a square foot.
Retail is surprisingly strong and has benefitted from the repurposing of some malls and larger retail spaces. Vacancy sits near 2.9 percent and availability at 3.2 percent, both well below national levels, the product of restrained construction and steady, population-driven demand. Asking rents have climbed about 4.4 percent over the past year, more than double the national rate and the eighth consecutive year of above-average growth, lifting Raleigh rents above the U.S. average for the first time. New supply is limited and largely spoken for: about 500,000 square feet is underway, roughly 0.7 percent of inventory, with some 85 percent pre-leased. Demand is following residents into the suburbs, where grocery-anchored and experiential retail are filling fast-growing communities in southern and eastern Wake County and in Johnston County. Tenant brokers report a genuine shortage of quality space, particularly for restaurants. Retail property traded at about $585 million over the year, with values near $270 a square foot, modestly above the national average.
Multifamily is the region’s largest commercial property type and the one most visibly digesting a supply wave. Raleigh’s roughly 140,000 apartment units carry a vacancy rate of 10.3 percent, down from a record 12.9 percent in early 2024 but still above both the market’s 8.9 percent historical norm and the 8.4 percent national rate; the stabilized rate, near 8 percent, indicates the overhang is concentrated in lease-up properties rather than the broader stock. Demand has stayed strong, with net absorption of about 6,200 units over the past year, well ahead of the 4,200-unit annual average and overwhelmingly (roughly 85 percent) in 4 & 5 Star product, though it has decelerated for several quarters. Supply is the swing factor: deliveries have cooled to about 4,800 units, near the long-run norm and far below the 10,000 completed in 2023, yet the 7,000 units still under construction equal 5.0 percent of inventory, nearly double the 2.7 percent national rate. That overhang has kept rents falling, with asking rents down 1.3 percent over the year and effective rents down 1.6 percent as many new lease-ups dangle up to three months free; asking rents average about $1,570 a month, a discount to the $1,790 national figure, and, unusually, the priciest submarkets are suburban, with Cary and Morrisville near $1,610, just ahead of Downtown Raleigh. Investment is thawing: sales of roughly $1.2 billion over the trailing four quarters ran about a third above the prior year but below the $1.6 billion ten-year average, at an average of about $220,000 a unit, with institutions such as Chicago-based Mesirow Financial paying $143 million, or $287,700 a unit, for the 497-unit Aster in Cary. With the pipeline shrinking and population growth still among the nation’s fastest, vacancies should grind lower and rent growth flatten, and likely turn positive, over the next several quarters.
Hospitality has been steadier and quieter. The market’s hotels carry an estimated value of about $5.3 billion, and sales volume of roughly $160 million across seventeen transactions ran near the long-run average, with regional owner-operators doing most of the buying. Occupancy near 65 percent, average daily rates around $135, and a market cap rate near 8.7 percent describe a healthy if unspectacular sector. The largest recent trade was the 353-room Sheraton Raleigh, which sold for $44.5 million, while newer assets such as the SpringHill Suites in Apex fetched the highest per-room prices. A few legacy properties face refinancing pressure, including the 401-room Marriott Raleigh City Center, on the CMBS watchlist ahead of a late-2026 debt maturity, a reminder that older urban hotels still carry pandemic-era scars even as the broader market has healed.
| Sector | Inventory / Value | Vacancy | Market Rent | 12-Mo Rent Growth | 12-Mo Sales Vol. |
|---|---|---|---|---|---|
| Industrial | 109.7M SF | 7.8% | $12.90 /SF | +2.7% | ~$1.6B |
| Office | 81.3M SF | 10.8% | $32.55 /SF | +2.9% | ~$352M |
| Retail | 76.3M SF | 2.9% | $28.57 /SF | +4.4% | ~$585M |
| Multifamily | 139,745 units | 10.3% | $1,568 /unit | −1.3% | ~$1.2B |
| Hospitality* | $5.3B value | 65.4% occ. | $134.72 ADR | +6.3% | ~$160M |
Sources: CoStar Group (Raleigh Office, Raleigh Multifamily, Raleigh Retail, Raleigh Industrial, and Raleigh/Durham/Chapel Hill Hospitality market reports, 26Q2); Southeast Economic Advisors. *Hospitality figures are sector-specific: estimated asset value, occupancy rate, average daily rate (ADR), and year-over-year change in sale price per room.
The Forecast
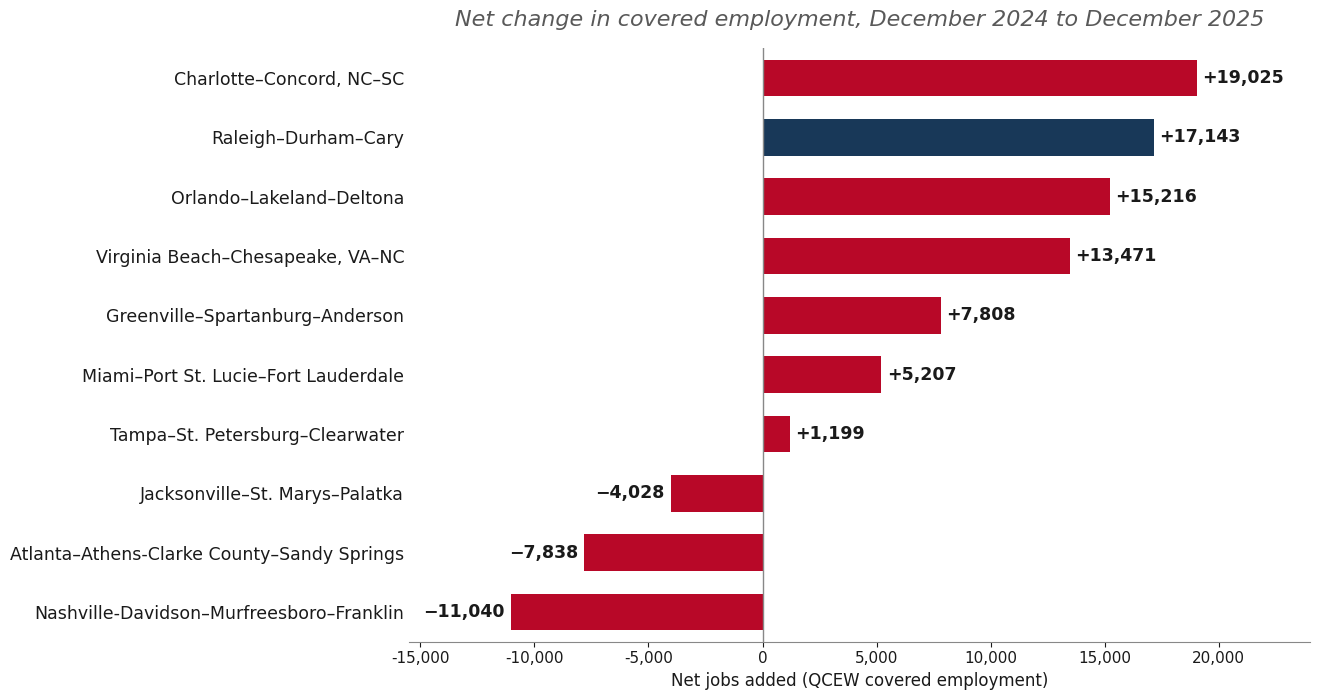
Research Triangle GDP and employment growth should continue to outpace national averages through 2030. We expect nonfarm payroll growth to re-accelerate as announced life sciences and technology investments convert to hiring. The influx of capital-intensive investment means real GDP growth will run comfortably ahead of the projected 2.3 percent U.S. pace and also rise at a sharper trajectory compared to employment. Our analysis of the latest QCEW employment data suggests that Raleigh’s job market proved to be more resilient during this past year’s nationwide slowdown, and we expect that resilience to continue. Population gains are expected to moderate slightly, reflecting the region’s greater dependence on international migration. Population growth should remain sufficient to support continued single-family construction, while apartment building is likely to decelerate. Home-price appreciation is expected to maintain a healthier, more sustainable pace.
| 2024 | 2025 | 2026F | 2027F | 2028–30F | 5-Yr Avg | |
|---|---|---|---|---|---|---|
| Real GDP growth (%) | 3.5 | 3.4 | 3.0 | 3.1 | 2.8 | 3.0 |
| Nonfarm employment growth (%) | 2.0 | 1.5 | 1.5 | 1.6 | 1.7 | 1.7 |
| Nonfarm employment change (000s) | 24 | 18 | 19 | 20 | 22 | 21 |
| Total population (millions) | 2.22 | 2.26 | 2.30 | 2.34 | 2.46 | n/a |
| Population growth (%) | 2.2 | 2.0 | 1.8 | 1.7 | 1.6 | 1.8 |
| Population change (000s) | 48 | 44 | 41 | 40 | 38 | 42 |
| Unemployment rate (%) | 3.5 | 3.4 | 3.6 | 3.7 | 3.6 | 3.6 |
| Median household income ($) | 95,000 | 98,500 | 101,500 | 105,000 | 116,000* | n/a |
| Median home price growth (%) | 2.0 | 0.5 | 1.5 | 3.0 | 4.0 | 2.6 |
| Median price of existing home ($) | 430,000 | 432,000 | 438,000 | 451,000 | 510,000* | n/a |
| Total housing permits (units) | 23,800 | 22,200 | 23,000 | 22,700 | 21,200 | 22,600 |
| Single-family permits (units) | 17,500 | 16,100 | 15,800 | 16,200 | 15,800 | 16,300 |
| Multifamily permits (units) | 6,300 | 6,100 | 7,200 | 6,500 | 5,400 | 6,300 |
Sources: BEA, BLS, U.S. Census Bureau, FHFA, National Association of Realtors; Southeast Economic Advisors estimates. *2028–30F values for median household income and median home price are 2030 endpoints, not period averages. F = forecast.
Risks to Watch
- Federal research funding. Cuts to the National Institutes of Health and federal science budgets are the most direct threat to the Triangle’s academic-research engine. The region’s universities and RTP companies are unusually exposed, and a sustained pullback would reach further here than in most metros.
- Technology concentration and project risk. Apple’s paused campus shows that even the largest tech commitments can slip. A broader AI-driven correction could expose the region’s technology base, though its university foundation provides meaningful ballast.
- Housing affordability and mobility. A price-to-income ratio near 5.3 and limited transit options could erode the region’s relative affordability advantage if supply fails to keep pace with in-migration.
- Talent and immigration policy. The region’s growing reliance on international migration and global scientific talent makes it sensitive to shifts in immigration policy.
The Final Word
The Triangle enters the second half of the decade where its leaders have spent decades trying to position it: at the center of a national economy that rewards research, talent, and applied science. The universities anchor the foundation of the Triangle’s economy, and the life sciences cluster supplies the momentum, while information technology, health care, and a large government workforce give the economy the ballast and resiliency that most Sun Belt peers lack.
Real tests lie ahead, chief among them federal research funding, housing, and mobility. But the advantages underneath are rare and slow to build, which is what makes them durable. As the Carolina Hurricanes take the ice at the Lenovo Center this week with a chance to bring the Cup back to Raleigh for the first time since 2006, the region around them makes a similar case: patient investment in fundamentals eventually produces a contender. The Triangle has built one.
Mark Vitner, Chief Economist at Southeast Economic Advisors LLC, certifies that the views expressed in this report accurately reflect his professional assessment of the subject matter and that no part of his compensation was, is, or will be directly or indirectly related to the specific views expressed herein.
This report is prepared for informational purposes only and does not constitute investment advice. Information is derived from sources believed to be reliable; however, Southeast Economic Advisors LLC makes no representation as to its accuracy or completeness. © 2026 Southeast Economic Advisors LLC. All rights reserved.