
SOUTHEAST ECONOMIC ADVISORS
Sports Economics | Annual Series
The Economics of College Football
2026 Edition
Name, Image and Likeness, the House Settlement and a Season Preview
College football has become a professional marketplace wearing a school's colors. Four seasons after the NCAA suspended its amateurism rules, the sport the Southeast has followed for a century runs on payrolls, salary caps and a transfer market that resembles free agency. The 2026 season, which opens August 29, is the second played under a formal revenue-sharing cap, now $21.3 million per school against $20.5 million in the settlement's first year. Last season produced a result the spending data did not predict. Indiana went 16-0 and won the national title on a roster that did not rank among the twenty-five most valuable in the sport, dispatching Alabama, Oregon and Miami in succession. Curt Cignetti had arrived from James Madison two years earlier with much of his roster.
The booster collectives that defined the early Name, Image and Likeness years have not vanished, but they now operate alongside direct school-to-athlete payments capped by the House settlement. The result is a two-tier system in which one pool of money is budgeted, disclosed and enforceable, and the other is none of those things. Recruiting and retention have reorganized around that split, and so, we would argue, has the competitive balance of the sport.
At a Glance
- The cap is now $21.3 million a school, up from $20.5 million in the settlement's first year, and it covers the whole athletic department rather than football alone.
- The capped pool is the smaller one. NIL Go had cleared $355.2 million of third-party deals through July 1, against Opendorse's estimate of a $4.5 billion market.
- Spending did not buy the title. Indiana went 16-0 on a roster outside the twenty-five most valuable, and now ranks tenth at $33.1 million.
- The audience is the largest in a decade. The championship drew 30.1 million viewers and the playoff averaged 16.3 million across eleven games.
- Below the FBS the settlement reads as a bill. Median FCS athletic revenue is $19 million against $145 million for the defendant conferences.
- Our Cinderella pick is Florida, with BYU and Oklahoma State behind it. None carries a top-ten roster valuation, which is the point.
From Booster Workarounds to a Salary Cap
The House settlement turned an unregulated bidding war into something closer to a capped payroll. Approved in June 2025, the agreement resolved three antitrust cases and rewrote the economics of the sport in a single stroke. Schools that opt in may pay athletes directly out of athletic revenue, up to $20.5 million in the first year and $21.3 million in 2026-27, a figure pegged near 22 percent of average Power Four revenue and set to climb about 4 percent a year. The cap covers the entire athletic department rather than football alone, and schools have planned to put roughly three-quarters of it into football, which puts the capped football payroll nearer $16 million than the headline number. For the first time the money reaching players is a budgeted, enforceable line item instead of off-balance-sheet collective money.
Scholarship limits gave way to roster limits, with football capped at 105 players who may all receive full aid. The agreement directs $2.8 billion in back pay to athletes who competed from 2016 forward, about $280 million a year over a decade, and it created the College Sports Commission to police both the cap and a clearinghouse called NIL Go. Third-party NIL money is still legal and uncapped, which is the seam the real arms race runs through. Deals above $600 must be reported, though since July 1 those below $15,000 skip fair-market review until an athlete crosses $50,000 in associated-entity compensation for the year.
| Provision | What changed for 2026-27 |
|---|---|
| Revenue-share cap | Schools may pay athletes directly up to $21.3 million in 2026-27, up from $20.5 million in the first year. The figure is pegged near 22 percent of average Power Four revenue and rises about 4 percent a year. The cap covers the whole athletic department, and football takes roughly three-quarters of it at most Power Four programs. |
| First payments | July 1, 2025. Every SEC and Big Ten school committed to funding the full cap from the opening season. |
| Back pay | $2.8 billion to athletes who competed from 2016 forward, about $280 million a year over ten years. Sixty percent of the assessed portion comes from the non-defendant conferences. |
| Roster limits | Scholarship caps replaced by roster caps. Football is limited to 105 players, all of whom may be on full scholarship. The grandfathering that protected displaced athletes does not extend to players cut in 2026-27. |
| Third-party NIL | Still permitted and uncapped. Deals above $600 must be reported, and since July 1, 2026 those below $15,000 skip fair-market review until an athlete reaches $50,000 in associated-entity compensation for the academic year. |
| Enforcement | The College Sports Commission, independent of the NCAA and led by Bryan Seeley, polices the cap and the NIL Go clearinghouse. Through July 1, 2026 it had cleared 34,195 deals worth $355.2 million and rejected 1,812 worth $89.9 million. |
Table 1. The House v. NCAA settlement, key provisions in force for 2026-27. Source: court filings, NCAA and College Sports Commission.
The cap is enforceable on paper, and the open question is whether the clearinghouse can price the market sitting above it. Through July 1 NIL Go had cleared 34,195 deals worth $355.2 million since launch and rejected 1,812 worth $89.9 million, against Opendorse's estimate that total athlete compensation will reach $4.5 billion in 2026-27, including roughly $735 million of commercial money above the cap. That distance is where the wealthiest programs likely retain their edge. Two arbitrations this year cut in opposite directions, one upholding the Commission's rejection of about $7.5 million of Nebraska deals and one ordering it to revise the model it had applied to Georgia athletes. We expect clearance volumes to keep rising as the thresholds bed in, and the check on that view is litigation: athletes at USC and Stanford sued in June to strike down the cap on antitrust grounds, with the motion to dismiss due September 11.
The Roster Arms Race
The cap functions as a floor, because only one of the two pools a roster runs on is capped. The capped pool is the $21.3 million a school may pay its athletes directly across all sports. The second is third-party NIL, which stays legal, uncapped and stacked on top. Every serious contender funds the full allotment, so that figure has become the minimum cost of fielding a contender. Roster valuations, which are market estimates of what a roster's players earn in a season from both pools and are separate from the scholarships that still cover tuition, housing and meals, run from the low thirties into the high forties of millions. Texas enters 2026 with the most valuable roster at an estimated $49.3 million on The NIL Standard's board, followed by Oregon ($43.4 million) and LSU ($42.8 million). Quarterback Arch Manning carries the highest valuation of any football player there at $6.8 million, though On3, which leans on confirmed deals, values him at $2.5 million and ranks Miami's Darian Mensah first across all college sports at $6.5 million.
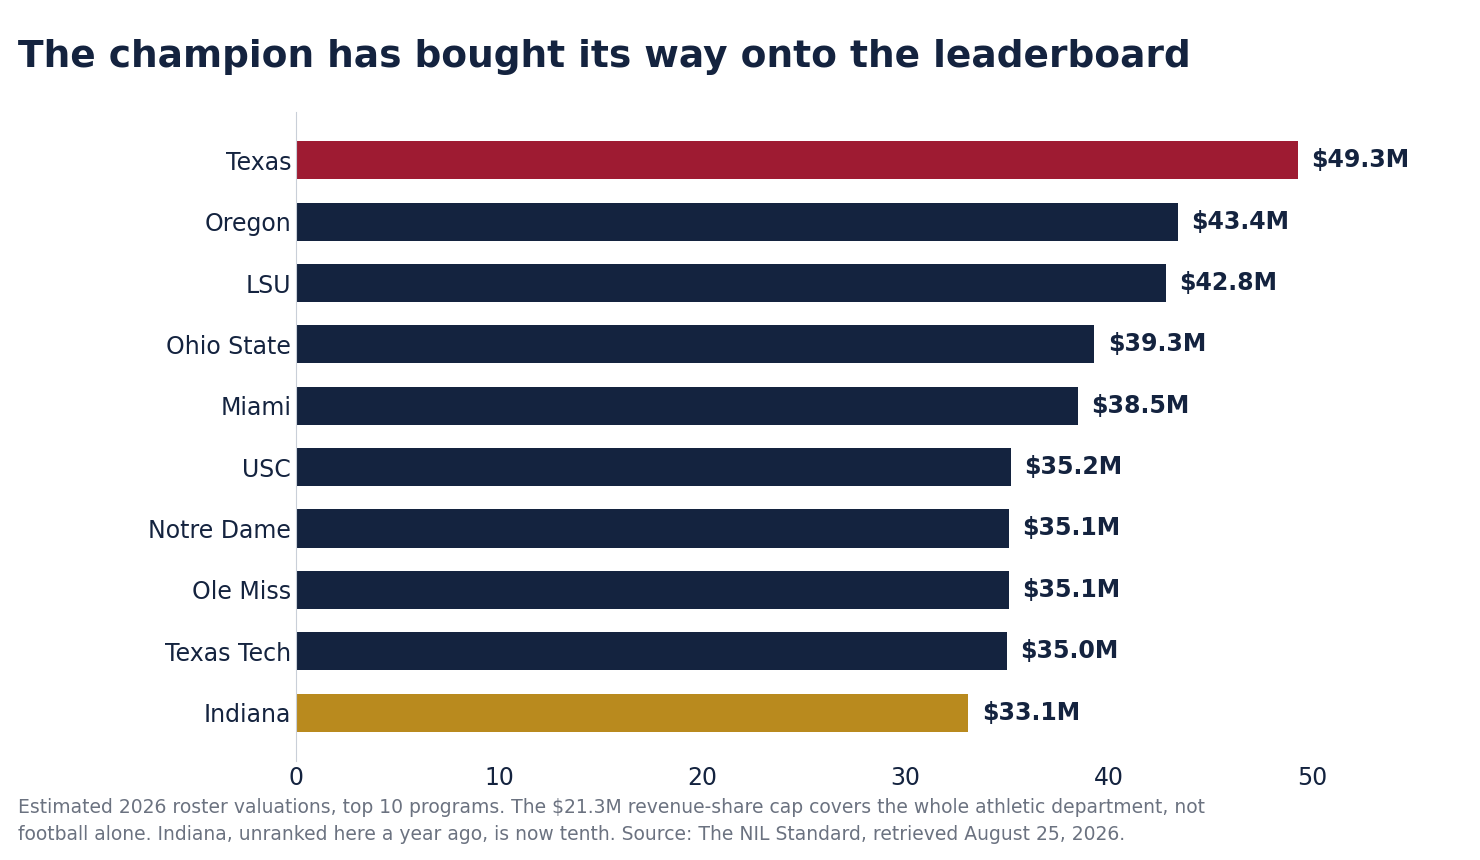
Spending now tracks ambition more closely than tradition, which is why LSU sits third on the valuation board after a 7-6 season. In Lane Kiffin's first offseason the Tigers assembled what CBS Sports called the sport's top portal class, and roughly $26 million of the program's $42.8 million roster value came from transfers. Two Power Four general managers told On3 in August that eight programs are spending above $40 million this season, with $50 million rosters expected by 2027. The Big Ten places four programs in the valuation top ten and the Southeastern Conference three.
The college option has become strong enough to change when players leave, and a set of August court orders may make leaving reversible. Only 63 underclassmen entered the 2026 NFL draft, 42 granted special eligibility and 21 who had finished their degrees with eligibility left, against 128 in 2021, though the count has run between 58 and 70 in three of the past four years. The arithmetic is not complicated. A prospect who goes undrafted is playing for a practice-squad slot worth $13,750 a week, roughly $250,000 across a full season, against an active-roster rookie minimum of $885,000 that most of them never reach. NCAA rules have long let a football player enter the draft once, go undrafted and return, provided he signed neither a contract nor an agent agreement. What is new is that players who signed and reported to camp are going back too, and only because a Louisiana judge issued a restraining order on August 19 covering sixteen football players. Dae'Quan Wright, who played at Virginia Tech and then Ole Miss, signed with Philadelphia as an undrafted free agent, was waived, claimed by Cleveland and waived again, and entered the transfer portal on August 20 with an agreement in place at LSU. We would not read much into this season's numbers, because the relief runs plaintiff by plaintiff, returning players may have to repay agent fees and professional earnings, and the NFL's cut to 53 falls on August 30, after the college season has started. Whether any court reaches the merits of the bar on returning after signing a professional contract is what would turn declaring early into a cheap option.
Did the Money Help the Blue Bloods?
On paper, the settlement looks like it should entrench the establishment. Programs with eight-figure rosters, donor bases and media exposure can reload through the portal every winter and absorb the new costs without strain, while those that cannot fund the full cap sustainably are increasingly priced out of keeping their best players, who transfer up. The settlement put an official price on a divide that predated it.
The blue bloods did not buy the trophy, and the champion has only now priced its way into the top ten. Indiana spent well below the leaders in 2025 and beat them anyway, and the program that held the record for the most all-time losses in major college football until Northwestern passed it last November finished 16-0. A year later the Hoosiers rank tenth in roster value at $33.1 million, which is roughly what a national title buys in this market. Money appears to purchase talent acquisition more reliably than it purchases coaching, culture or development.
Recruiting rankings tell the same story, with USC topping the 2026 high school class and the defending champion signing the twenty-ninth. The blue-chip classes still cluster at the traditional powers, but Indiana built its title roster through the transfer portal, where more than 3,350 players, about a quarter of FBS scholarship rosters, entered in the January window alone. If the champion's roster again outperforms its recruiting rank in 2026, the signing-day rankings will have lost much of whatever forecasting value they retain.
Where the Money Comes From
Media rights are the largest revenue line for the major public programs, and the new playoff agreement enlarges them again this season. Conference distributions and media rights come first, followed by donor contributions and ticket sales. The playoff's six-year agreement with ESPN, worth $7.8 billion, pays about $1.3 billion a season beginning with the 2026 postseason, and that money flows disproportionately to the two conferences that control the bracket. Texas reported $352.5 million of athletic revenue in fiscal 2025, more than any other program filing a public report, with $167.8 million of donor contributions its largest single source, and Ohio State followed at a record $336.1 million.
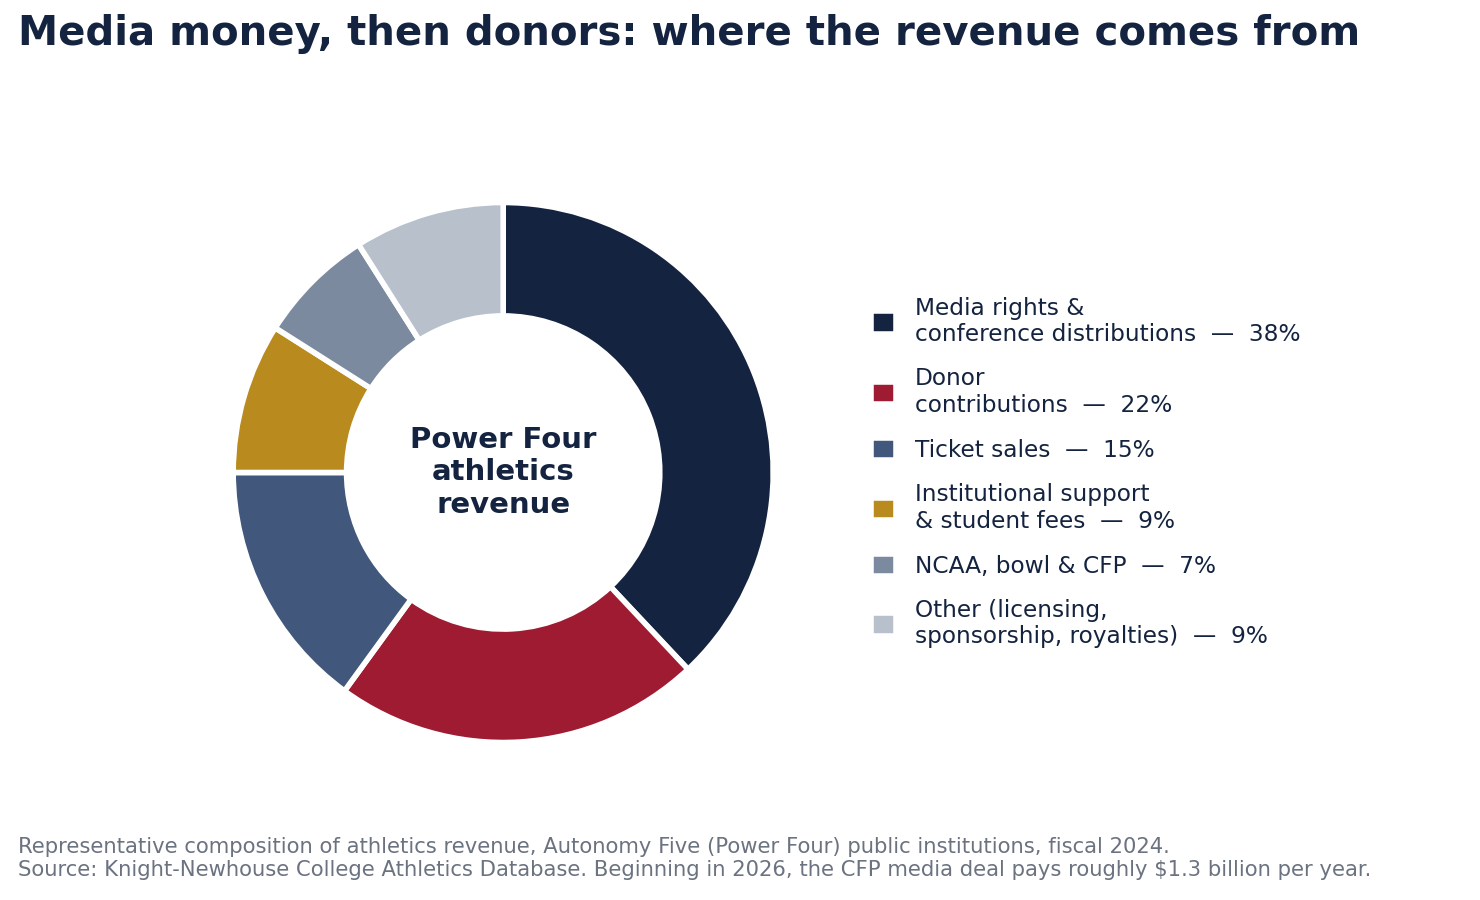
Revenue is rising fast, and so is the cost structure beneath it, which is why the program that earns the most also lost money last year. Texas spent $375.9 million in fiscal 2025 against $352.5 million of revenue, a $23.4 million deficit and a national spending record. A 2023 analysis by CliftonLarsonAllen for the Knight Commission projects public Football Bowl Subdivision programs will generate $20.9 billion of athletics revenue a year by 2032, and that projection predates revenue sharing entirely. For programs outside the top tier the new revenue rarely closes the gap, because the cost of competing rises at least as fast.
The Fan Economy
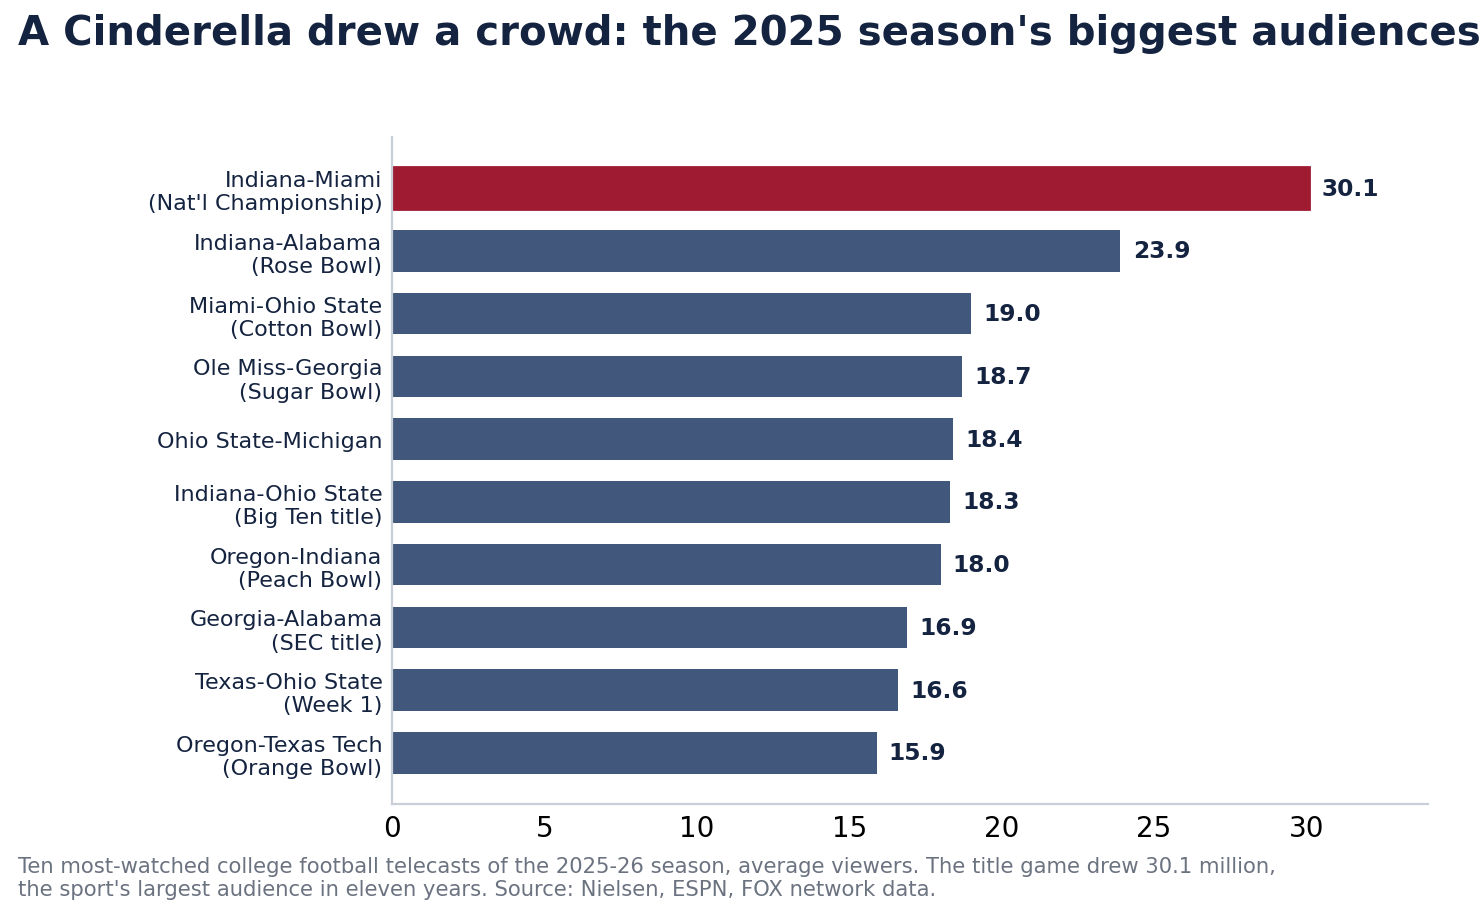
The audience has grown even as the industry's structural anxieties have, and the 2025 season made the point emphatically. College football is the second-most-watched sport in the country behind the NFL. Indiana's championship win over Miami drew 30.1 million viewers, the largest audience in eleven years and 36 percent above the prior title game. The full playoff averaged 16.3 million across eleven games, up 4 percent, and regular-season viewership rose 2 percent, led by Ohio State-Michigan at 18.4 million.
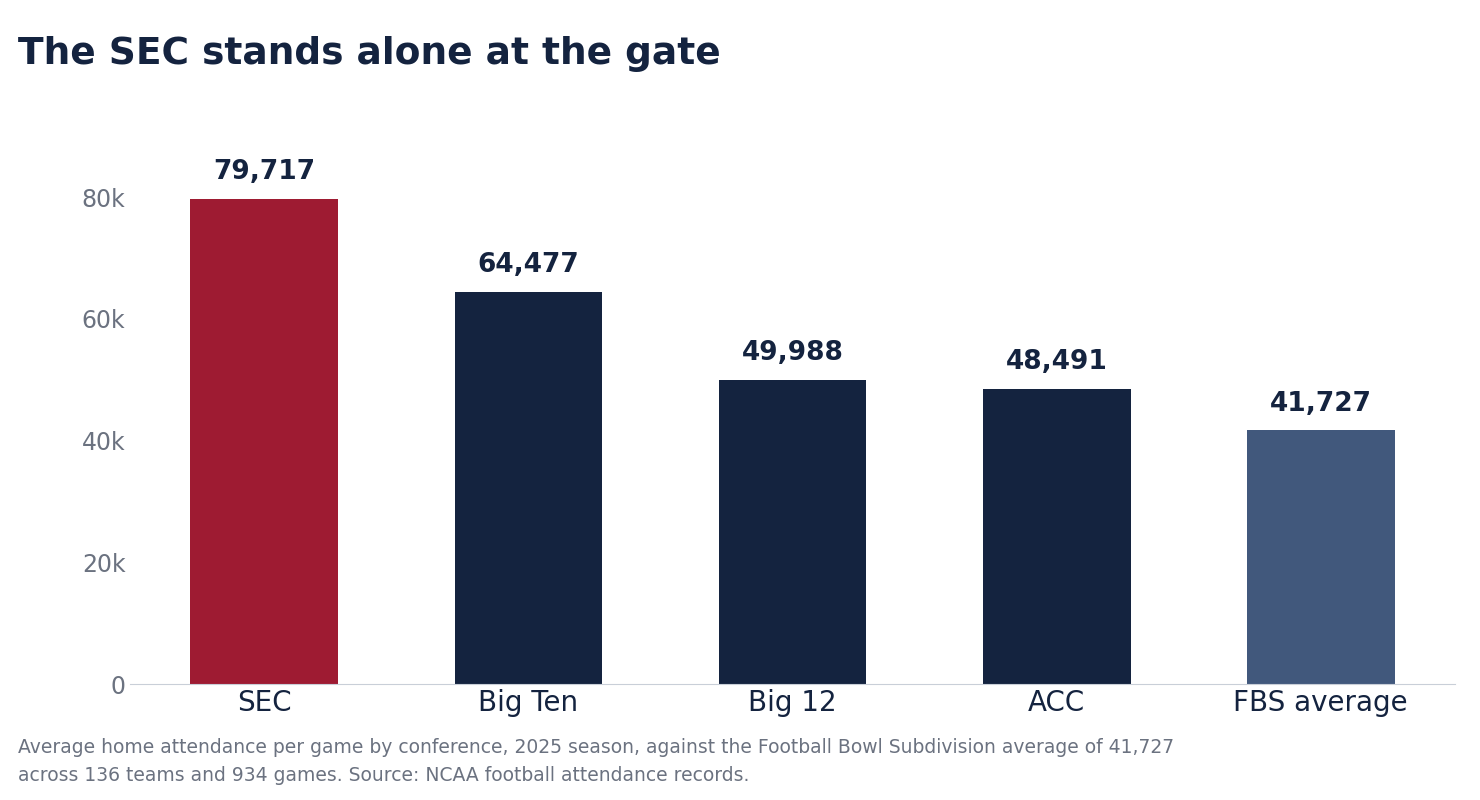
Attendance concentrates even more sharply than television money, and the Southeastern Conference stands alone at the gate. SEC programs averaged 79,717 fans a game in 2025 against 64,477 in the Big Ten, 49,988 in the Big 12 and 48,491 in the Atlantic Coast Conference, with the Football Bowl Subdivision averaging 41,727. The two leagues holding the largest television contracts also draw the largest crowds, which likely compounds the revenue gap instead of merely reflecting it.
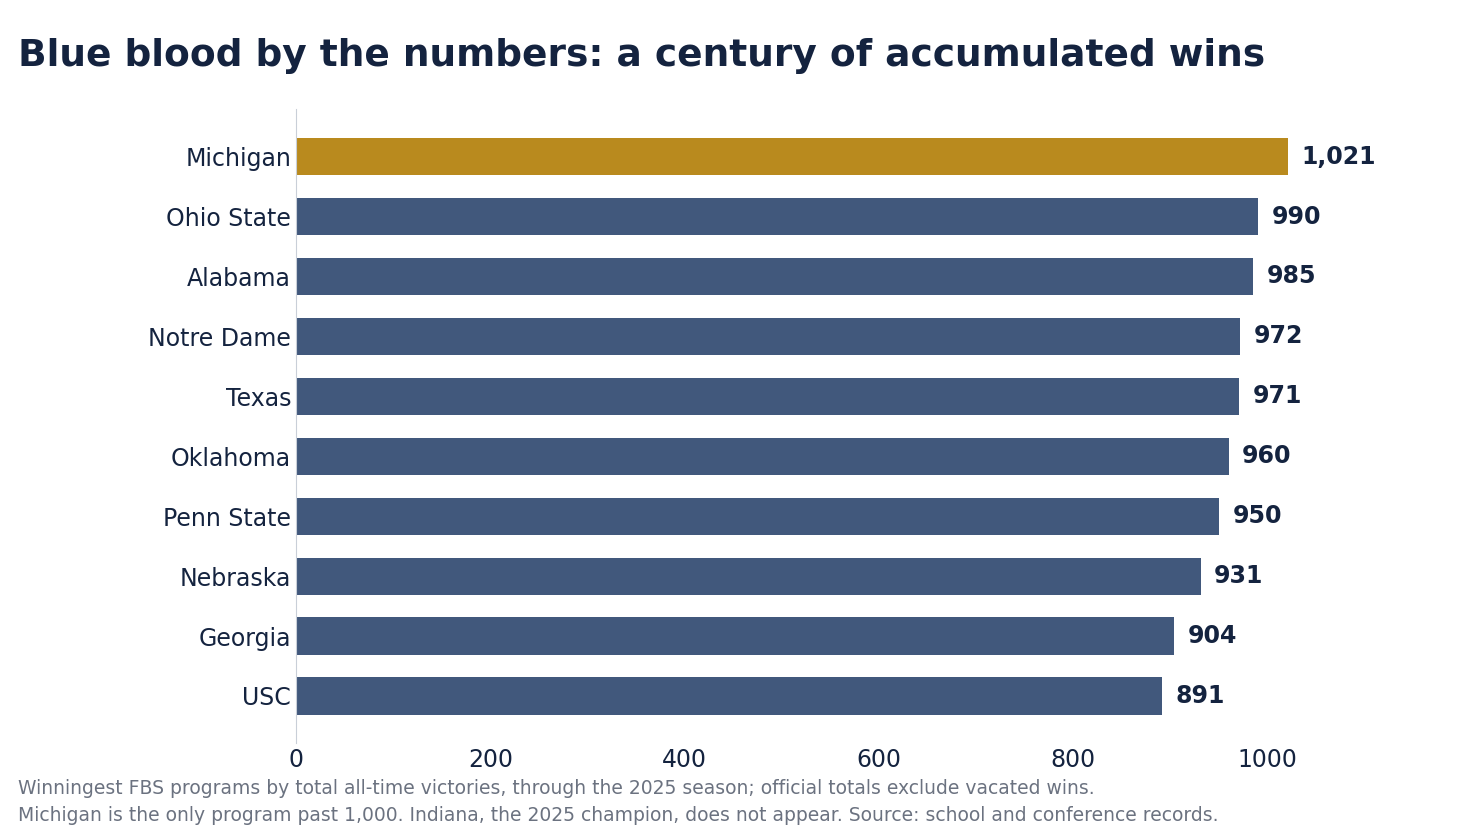
History still belongs to the establishment, and Michigan is the only program past 1,000 all-time wins. Ohio State (990), Alabama (985), Notre Dame (972), Texas (971) and Oklahoma (960) follow, the familiar roll call of the sport's aristocracy. Indiana appears nowhere on that list, and brand equity of that depth is why one 16-0 year does not disturb the standing hierarchy.
Previewing the 2026 Season
The race opens wider than it has in years, but with a clear favorites' tier. The Associated Press preseason poll, released August 17, opened with Ohio State first on 40 of 69 first-place votes, followed by Oregon, Georgia, Notre Dame, Texas and the defending champion at sixth. The Big Ten, which has won three straight national titles, enters as the deepest league, with Ohio State's Julian Sayin and receiver Jeremiah Smith returning together and Oregon's Dante Moore having passed on the draft. Indiana opens sixth despite going unbeaten, in part because quarterback Fernando Mendoza went first overall and Cignetti replaced him with TCU transfer Josh Hoover.
| Rk | Team | League | 2025 | Why they are here |
|---|---|---|---|---|
| 1 | Ohio State | Big Ten | 12-2 | Sayin and Smith return together; 40 of 69 first-place votes |
| 2 | Oregon | Big Ten | 13-2 | Dante Moore passed on the NFL Draft |
| 3 | Georgia | SEC | 12-2 | Smart reloads and the title window stays open |
| 4 | Notre Dame | Indep. | 10-2 | CJ Carr returns; the Irish declined a bowl bid last year |
| 5 | Texas | SEC | 10-3 | Arch Manning year, with Ohio State in Austin on September 12 |
| 6 | Indiana | Big Ten | 16-0 | Defending champion, replacing the first overall draft pick |
| 7 | Miami | ACC | 13-3 | A field goal from the title; Mensah leads the offense |
| 8 | Texas A&M | SEC | 11-2 | Elko's Aggies aim for a deeper run |
| 9 | Ole Miss | SEC | 13-2 | Chambliss back to run it again |
| 10 | Oklahoma | SEC | 10-3 | Mateer healthy behind a defense that carried 2025 |
Table 2. The Associated Press preseason top 25, released August 17, 2026, top ten shown. Records are 2025 final results.
The structure of the season has changed as much as the standings, and the twelve-team playoff is now in its third year. The expanded bracket has widened the path to a title and rewarded teams that peak in November, and Indiana's run showed it can be won from outside the traditional aristocracy. The SEC's move to a nine-game conference schedule has made high-profile non-conference matchups scarcer and conference survival harder. The Tenth Circuit stayed a nationwide eligibility injunction on August 21 in Wisne v. NCAA, pulling a set of fifth-year players off rosters days before kickoff while leaving the state-court orders untouched. We expect the nine-game schedule to cost the SEC at least one playoff berth it would have claimed under the old format, and a year in which the league places four teams in the bracket anyway would tell us the strength-of-schedule adjustment is doing more work than we think.
This Year's Cinderella
Indiana set the template, so the question is who fits it next. The 2024 Hoosiers were the Cinderella and the 2025 Hoosiers were the champion. Repeating that arc appears to require four conditions at once. A program needs latent resources, a new or ascendant coach, a transfer-built roster with an upgrade at quarterback and a schedule that opens a lane. Three programs meet all four in 2026.
| Program | New leadership | The case for a breakthrough |
|---|---|---|
| Florida (our pick) | Jon Sumrall | Won two Sun Belt titles at Troy, then took Tulane to the American championship and a playoff berth. Aaron Philo settled the quarterback job on August 24. The seventh-toughest schedule in the country is the obstacle. |
| BYU | Kalani Sitake | Twelve wins and first team out of the 2025 bracket, with Bear Bachmeier back and a Big 12 schedule that skips defending champion Texas Tech. The program has never reached the playoff. |
| Oklahoma State | Eric Morris | The bold swing. Morris brought his North Texas staff and quarterback Drew Mestemaker, the 2025 national passing-yardage leader, to a program that went 1-11 and winless in the Big 12. |
Table 3. Our 2026 Cinderella watch. Selections reflect coaching change, roster construction and schedule, in the spirit of Indiana's run.
Florida is our pick to be this year's Indiana, and the case rests on a coach who has already taken a smaller program to the playoff. Jon Sumrall won consecutive Sun Belt titles at Troy, then took Tulane to an American Athletic Conference championship and a playoff berth in 2025. He inherits an SEC program with resources he has never had and a roster with more talent than a 3-9 season suggests, and he named Georgia Tech transfer Aaron Philo his starting quarterback on August 24. Florida draws what ESPN's model rates the seventh-toughest schedule in the country, however, and the Gators enter unranked. Their results also appear momentum sensitive. When the program is winning it builds on that success and on the excitement surrounding it, and when it is losing, things have a habit of going downhill fast, even in a state with few hills.
BYU and Oklahoma State round out the wager, and neither carries a top-ten roster valuation. BYU went 12-2 last season and finished twelfth in the final playoff rankings, first team out, and it has never reached the field in any format. Bear Bachmeier returns at quarterback and the Cougars' Big 12 schedule skips defending champion Texas Tech. Oklahoma State is the bold swing, a near-total rebuild under Eric Morris, who arrived from North Texas with quarterback Drew Mestemaker, the national passing-yardage leader in 2025, at a program that went 1-11. Indiana's title roster did not appear on the valuation leaderboard either, which is why we look for the next Cinderella below the top of it.
Below the FBS: HBCUs, the FCS and Divisions II and III
The revenue-sharing revolution is almost entirely a Division I story, and mostly a Power Four one. The $21.3 million cap, the eight-figure rosters and the donor arms race all live at the top of the sport. One rung down, the same settlement reads as a bill. For the historically Black colleges, the Football Championship Subdivision and Divisions II and III, which make up most of college football by headcount, the new money has arrived mainly as cost and disruption.
For most historically Black college programs, the cap is an abstraction. Nearly all Division I HBCU football is played in the Football Championship Subdivision, concentrated in the Southwestern Athletic Conference and the Mid-Eastern Athletic Conference. The Knight Commission puts median FCS athletic revenue at $19 million against $145 million for the defendant conferences, so the cap that applies to a single Texas athletic department exceeds an entire FCS budget. The SWAC opted in across the board nonetheless, at a collective cost of about $30 million over the decade, and all six MEAC football members have now followed. Morgan State owes roughly $231,000 and has trimmed its football roster from 130 to 105, and the payments these schools can fund amount to a rounding error beside the leaders.
For the FCS as a whole, the settlement landed mostly as an assessment. HERO Sports counted 103 FCS programs opting in for 2026-27 against 20 opting out, up from 92 and 36 a year earlier, though opting in is largely symbolic where median athletic revenue is $19 million. The harder reality is that the $2.8 billion in back pay is collected disproportionately from schools that will not receive it, with 60 percent of the assessed portion coming from the non-defendant conferences while an estimated 95 percent of the damages flow to football and basketball players inside them. The clearinghouse cuts the other way, since it is meant to stop wealthy programs from poaching FCS standouts with inflated NIL deals. Within the subdivision, however, the removal of scholarship caps lets the established powers fund deeper rosters than their peers can match.
Divisions II and III sit outside revenue sharing entirely, yet not outside its gravity. Neither division shares revenue and Division III awards no athletic scholarships, so the direct money barely touches them. The 105-man roster limit is squeezing out the walk-ons that large programs once carried, pushing capable players down even as the portal lets those divisions' standouts move up. Both also face leaner NCAA distributions, and a handful of small Division I schools, among them Saint Francis and Hartford, have chosen to reclassify to Division III instead of absorbing the rising cost of competing.
| Level | Typical resources | How the new money landed |
|---|---|---|
| FBS, Power Four | $150M+ budgets; rosters $33M to $49M | Fund the full $21.3M cap, then stack uncapped NIL on top. Texas alone reported $352.5M of revenue in fiscal 2025. |
| FBS, Group of Five | Mid-size media deals | Rarely fund the full cap. Talent drains upward and retention costs climb. |
| FCS (most HBCUs) | Median athletic revenue near $19M | Cannot approach the cap, yet help fund the back pay through reduced NCAA distributions. 103 opted in and 20 opted out for 2026-27. |
| Division II and III | No revenue sharing; D-III gives no athletic aid | Absorb walk-ons squeezed out above, lose standouts to the portal, and face leaner NCAA distributions. |
Table 4. How the new money reached each level of college football. Sources: NCAA, College Sports Commission, Knight Commission, HERO Sports and conference reports.
The Bottom Line
The money has professionalized college football, but it has not made it predictable. The settlement gave the sport a salary cap, a clearinghouse and an enforcement arm, formalizing a player economy Opendorse now estimates at $4.5 billion a year, and the top rosters are valued between $33 million and $49 million while Group of Five programs rarely fund the full $21.3 million cap. The defining result of the new era, however, was a worst-to-first championship won by a program that out-coached and out-developed the teams that outspent it. We expect the favorites' tier to reassert itself in 2026, and the condition that would break that call is Florida, BYU or Oklahoma State reaching the semifinals, which would put two straight Cinderellas in a bracket the cap was meant to stabilize.
Mark Vitner
Chief Economist, Southeast Economic Advisors
About this report
The Economics of College Football is part of an annual sports-economics series published by Southeast Economic Advisors. The 2026 edition draws on figures from the College Sports Commission, the NCAA, the Knight Commission, Nielsen and network viewership data, HERO Sports, Opendorse, and roster-valuation and recruiting services as cited above. Roster valuations are market estimates of open-market compensation, they differ materially between providers, and they should be read as directional.
This material is provided for informational and educational purposes only and does not constitute investment, legal, tax, or financial advice, nor a recommendation regarding any security or wagering market. Opinions reflect our judgment as of the publication date and are subject to change. Figures are drawn from sources we believe to be reliable, but their accuracy and completeness are not guaranteed.
© 2026 Southeast Economic Advisors. All rights reserved.