
Charlotte Is Getting Tighter by Subtraction
Charlotte is finishing 2026 with a tighter commercial real estate market than its construction pipeline would suggest, and the reason is subtraction rather than demand. About 2.6 million square feet of office space is leaving uptown's inventory through conversion, and none of it appears in any vacancy rate.
Key Takeaways
- Roughly 715,000 square feet has already left uptown's office inventory through conversion and another 1.9 million square feet is queued behind it. Office vacancy fell 1.2 percentage points over the year to 13.1% and is below the national rate for the first time since late 2023.
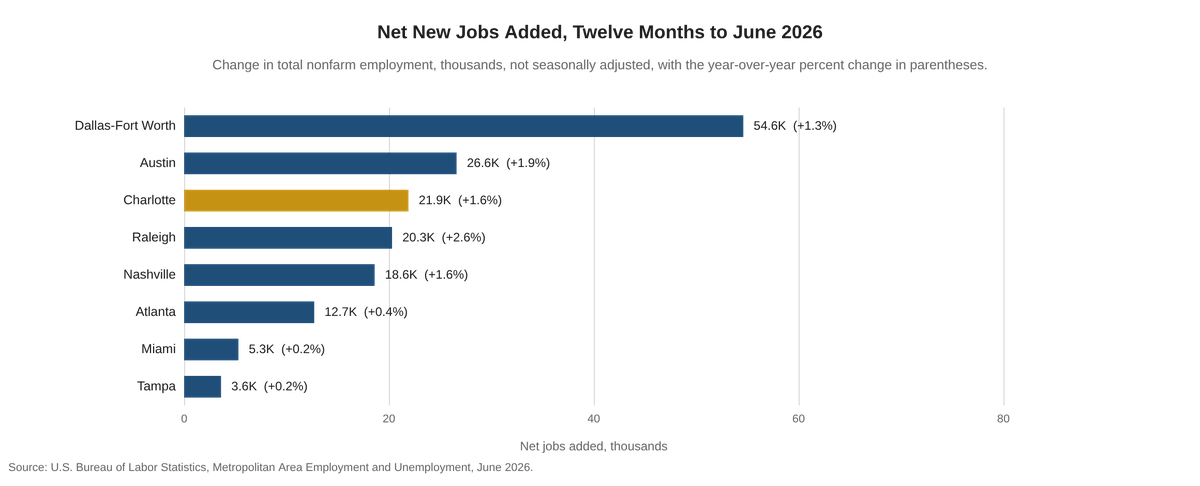
- Charlotte added 21,900 jobs over the twelve months to June, a 1.6% gain, and our revised forecast now carries about 20,000 for the full year. Only Dallas and Austin added more among Sun Belt peers, and both are larger markets.
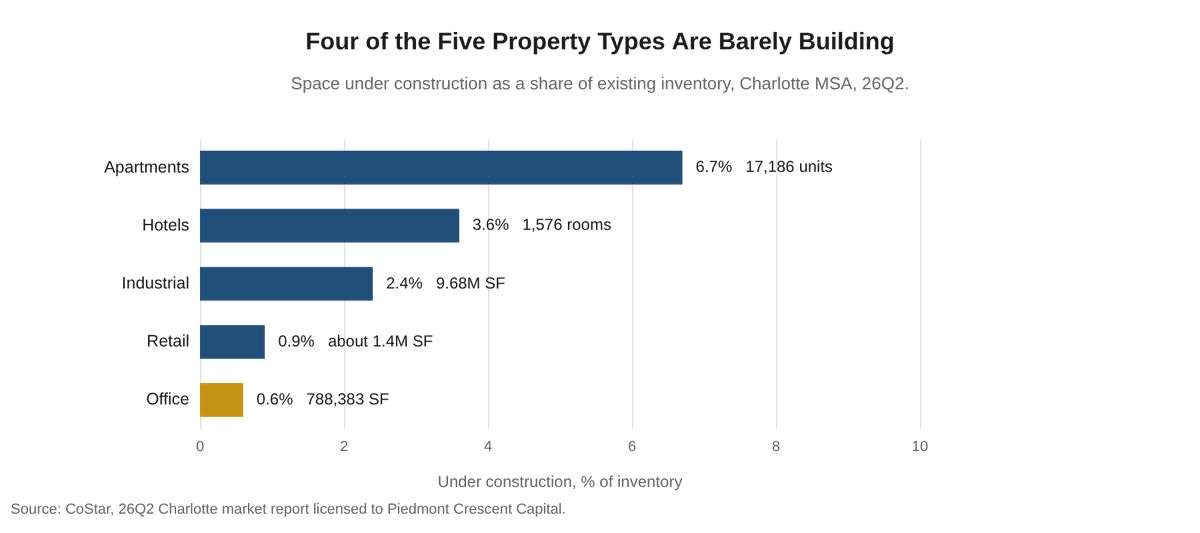
- Office, retail and industrial are building at 0.6%, 0.9% and 2.4% of stock. Four of the five property types have a pipeline that is thin by the standards of this expansion, and apartments are the exception.
- Seven financial institutions have committed more than 4,100 jobs in fourteen months at salaries running 20% to 114% above Mecklenburg County's $90,706 average. The constraint on that thesis is wage pressure rather than space.
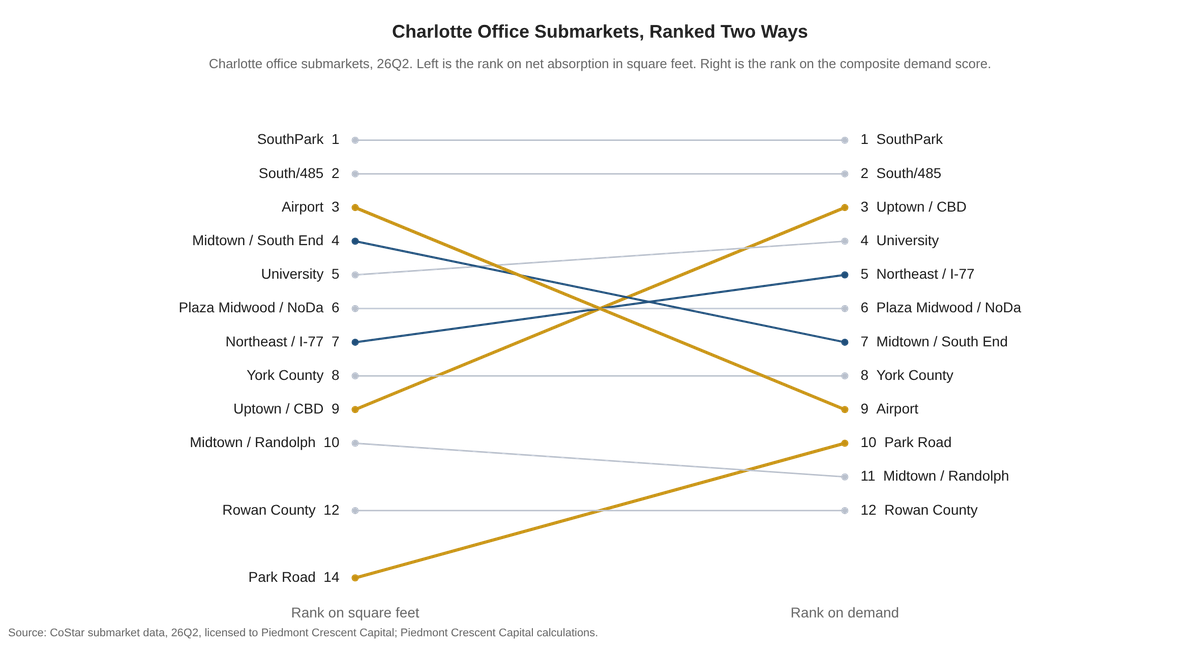
- Ranking submarkets on demand rather than size reorders the market. The Airport submarket ranks third on raw square feet absorbed and ninth on the composite. Uptown ranks ninth on square feet and third on the composite.
The Labor Market Turned Back Up
The annual benchmark revision cut 2025 job growth to 13,000 and 0.9%, from a preliminary reading near 2.7%. Charlotte then added 21,900 jobs over the twelve months to June, a 1.6% gain. The metro unemployment rate was 3.6% in June, down from 4.0% a year earlier.
The composition matters more than the total. Professional & business services and financial activities added 5,500 jobs between them, which is where office demand comes from. Construction leads everything at 7,600 jobs and 9.0%. Manufacturing and information gave back 5,400 between them, which is why the headline number reads softer than the office market feels.
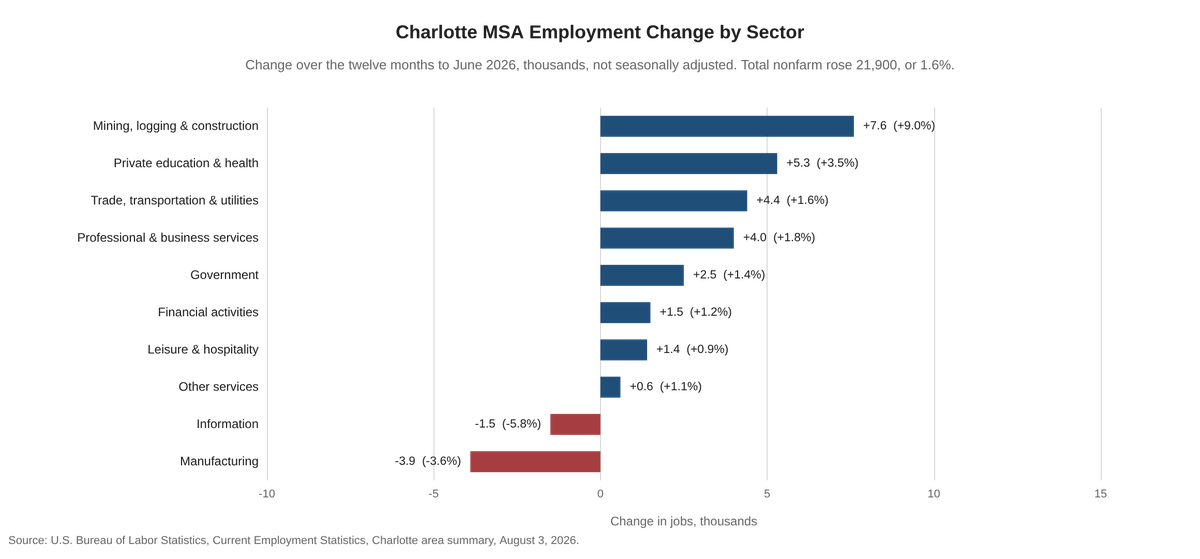
The sectors that lease office space are still hiring. The sectors that do not are the ones giving jobs back.
Office: The Denominator Is Shrinking
Charlotte office absorption is concentrated, not diffuse. Capital Group took 196,940 square feet at One Independence, Sumitomo Mitsui subleased 192,770 square feet from Wells Fargo at 301 South College, JPMorganChase took 140,000 square feet at One Piedmont Town Center in SouthPark, and Charles Schwab took 30,000 square feet at 110 East in South End. Two preleases, Moore Van Allen at 206,000 square feet and Pacific Life at 68,000, are the entire reason a 400,720-square-foot tower is rising in a market with almost no other construction.
Only 788,383 square feet is under construction, six tenths of one percent of a 136 million square foot market, and 26Q2 was the lowest delivery quarter in CoStar's Charlotte record. Vacancy is now falling through removals as much as through leasing. Conversions at 400 South Tryon, 301 South Tryon and 200 North College will take another 1.9 million square feet out permanently, and the count keeps growing. Charlotte Center City Partners counts eight uptown conversions proposed or under construction, against the five CoStar and CBRE identified in June. The three additions are The Fowler Building at 1447 South Tryon, going from office to hotel and retail, Hilton's conversion of part of the office space at FNB Tower on South Graham to hotel, and The Maple, Johnson & Wales University's conversion of a former hotel at 895 West Trade into student housing. Together the eight will produce more than 760 hotel rooms, more than 1,620 apartments, about 240 student housing units, 170,000 square feet of retail and 250,000 square feet of office.
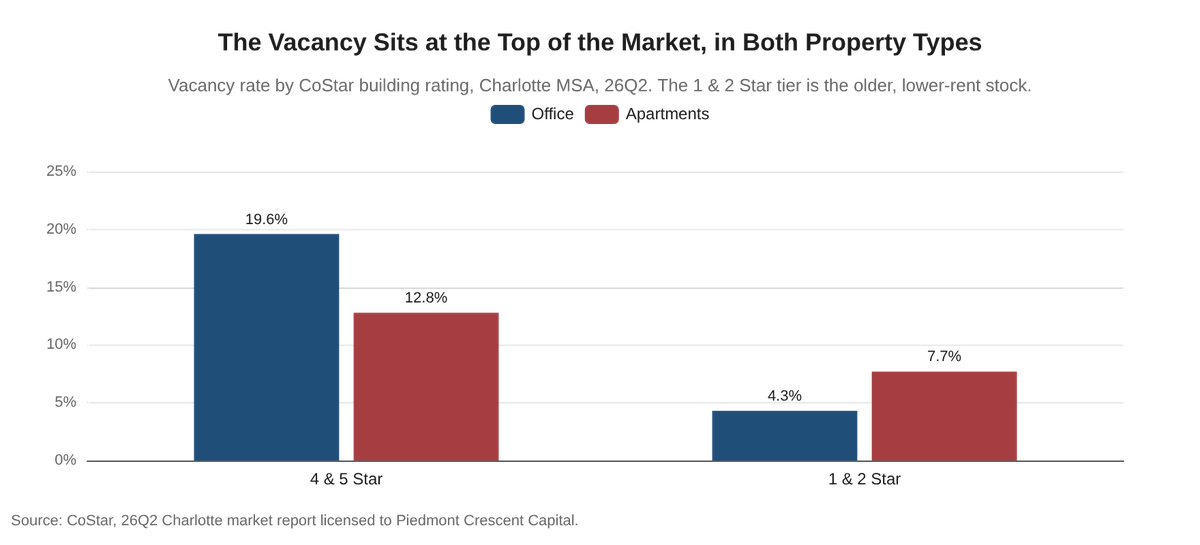
The market is bifurcated by vintage, not by geography. Vacancy runs 19.6% in 4 & 5 Star buildings at $44.36 a foot and 4.3% in 1 & 2 Star buildings at $26.23. The interesting tier is in between. Premier suburban submarkets are keeping pace with uptown's best: Citi's expansion at the Gragg Building in Ballantyne carried a $49.50 gross asking rate in May.
Industrial: The Middle Is Soft
Industrial had the largest vacancy increase of the five property types, up 0.2 points to 9.9%, and it is the one sector where supply clearly ran ahead of demand. Availability in properties larger than 400,000 square feet fell more than 300 basis points to 9.7%, while availability in boxes of 100,000 to 400,000 square feet rose more than 300 basis points to 15.9% as midsize manufacturers deferred decisions on trade policy.
The data center buildout is now showing up in industrial rent rolls. Google leased more than 729,000 square feet at Overlook 85 in Rowan County to support its $1 billion Caldwell County campus, and Kuehne + Nagel took 475,000 square feet at the I-485 Logistics Center to handle equipment for Siemens' turbine plant expansion. An additional 9.7 million square feet is underway at 56.5% preleased. Groundbreakings, however, have fallen by more than half over the past two years.
The forward risk in industrial is not the pipeline, it is the renewal calendar. Cushman & Wakefield counts 46.1 million square feet of Charlotte industrial leases expiring between 2026 and 2031, peaking in 2028 at 10.8 million square feet, which is 65% above the five-year historical average. Southwest Charlotte carries 12.8 million square feet of it, and 61.6% of that sits in leases of 99,000 square feet or smaller, which spreads the risk across a large number of small decisions made at roughly the same time. York County is the mirror image, with 68% of its expirations in leases of 250,000 square feet and larger. These are Cushman & Wakefield figures rather than CoStar figures.
Retail: Nothing Gets Built and Nothing Sits Empty
Retail is the tightest property type in the market at 3.3% vacancy, and it is that tight because almost nothing is delivered. Charlotte added 855,000 square feet into a 154.6 million square foot market over the past year, with 0.9% of stock under construction.
The division inside the market is income, not geography. Where median household income within two miles exceeds $100,000, absorption has been positive for six consecutive quarters and availability has fallen below 3%. Below that line, absorption is negative and availability approaches 5%.
Indian Land is the clearest illustration. A 156,000-square-foot Costco, a 149,000-square-foot Target and a Lowes Foods all opened within a mile of each other over three weeks last October, anchoring Crosland Southeast's 130-acre Exchange at Indian Land. Roughly 880,000 square feet more sits in the Lancaster County pipeline. The constraint is entitlement rather than demand: Lancaster County enacted a nine-month moratorium in the Indian Land panhandle in November, Fort Mill extended its own, and Lancaster permit requests were down 20% year over year as of late January.
Apartments: The Turn Is Arithmetic
Charlotte apartments absorbed a near-record 14,511 units over the past year and rents still fell, with asking rents down 0.9% and effective rents down 2.4%. The gap between the two is concession burn. Vacancy finished at 11.4%, and the supply landed almost entirely at the top of the market: 12.8% vacancy in 4 & 5 Star product against 9.8% in 3 Star and 7.7% in 1 & 2 Star.
Deliveries are falling while absorption holds near a record, so the 17,186 units under construction are the last of the wave. Watch concessions rather than asking rents, because concessions come off first and asking rents follow two to three quarters later. The geography has moved with the households: Kannapolis, Indian Land, Matthews and Cornelius account for four of the eight largest projects under construction in the region.
Hotels: The Quarter Beats the Year
RevPAR is down 3.8% over the trailing year and up 15.5% in the most recent quarter, and occupancy of 65.7% is down 4.1% over the year against a 65.2% historical average. Uptown is the exception on rate, and CoStar attributes the strength in transient demand there to business travelers and convention attendees. Supply is the risk. Charlotte has 1,576 rooms under construction across fifteen hotels, or 3.6% of inventory, against 2.4% nationally and a three-year average delivery pace of 440 rooms.
Ranking the Submarkets on Demand Rather Than Size
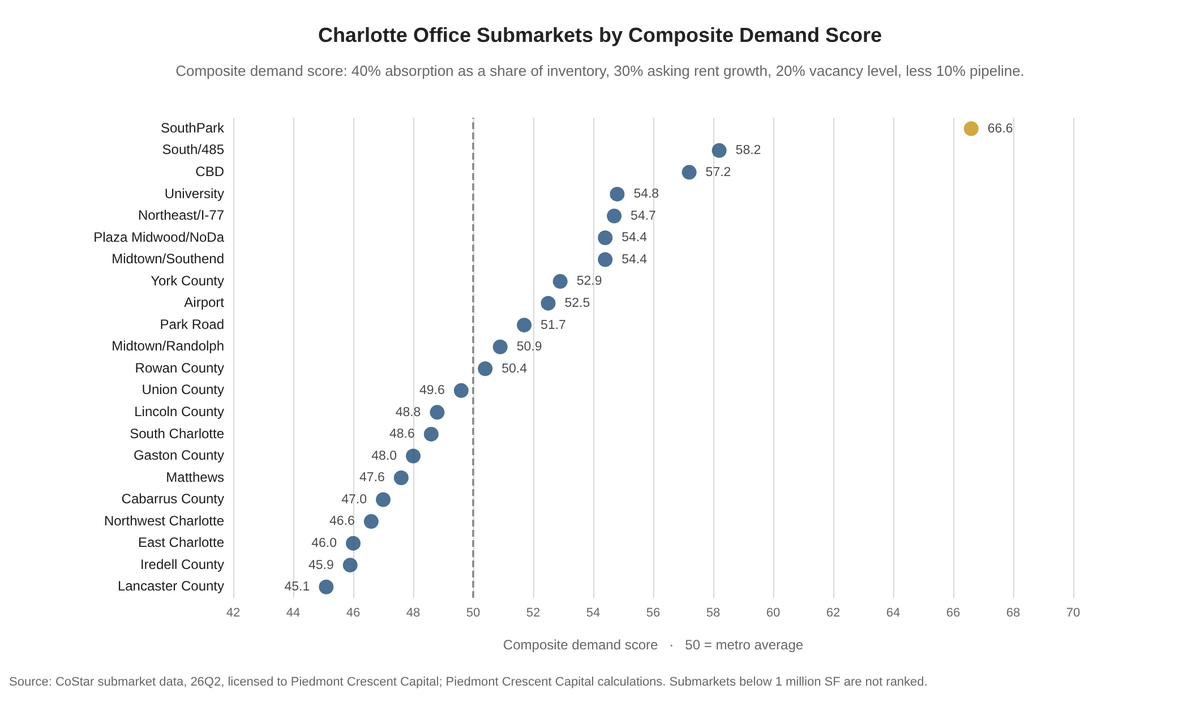
Every brokerage report leads with net absorption in square feet, and that number mostly measures how large a submarket already is. We scored all eighty-one Charlotte submarkets on a composite of absorption as a share of inventory (40%), asking rent growth (30%) and vacancy level (20%), less the construction pipeline (10%), with an adjustment that pulls small submarkets toward the metro average so a single lease cannot win the ranking outright.
The reordering is substantial. On raw square feet, the Airport submarket ranks third in office. On the composite it ranks ninth, because it absorbed 253,999 square feet into a 14.4 million square foot base carrying 18.2% vacancy. Uptown does the opposite, ranking ninth on square feet and third on the composite, because it absorbed almost nothing against 25.3 million square feet and still posted the market's best asking rent growth at 4.9%.
| Property type | Leads the composite | Score | What earned it |
|---|---|---|---|
| Office | SouthPark | 66.6 | Absorbed 6.0% of inventory at 8.1% vacancy on 4.0% asking rent growth |
| Industrial | Rowan County | 56.6 | 12.8% absorption, though a single 729,000 SF Google lease is much of it |
| Retail | Lancaster County | 60.8 | 5.6% absorption, more than three times any other ranked retail submarket, on 4.6% rent growth |
| Apartments | South End | 60.9 | 13.6% absorption on 17,151 units, the highest absorption rate of any ranked apartment submarket |
| Hotels | Charlotte CBD | 63.6 | The only Charlotte hotel submarket holding occupancy flat, on 1.4% ADR growth |
Defense Is a Demand Driver Worth Watching
Defense manufacturing arrived in the Carolinas over the past year, and the buildings it needs are ordinary industrial buildings. SteelFab is investing $38.9 million in a new plant at 500 Freedom Boulevard in Florence, South Carolina, creating 108 jobs and fabricating steel for U.S. naval defense. Skyeton is putting its first U.S. drone plant into 28,500 square feet of the former Black & Decker building in Fayetteville. USA Rare Earth has signed a twenty-year lease on 800,000 square feet in Blacksburg, South Carolina, 45 miles west of Charlotte, for a $1.2 billion magnet and refined metals plant.
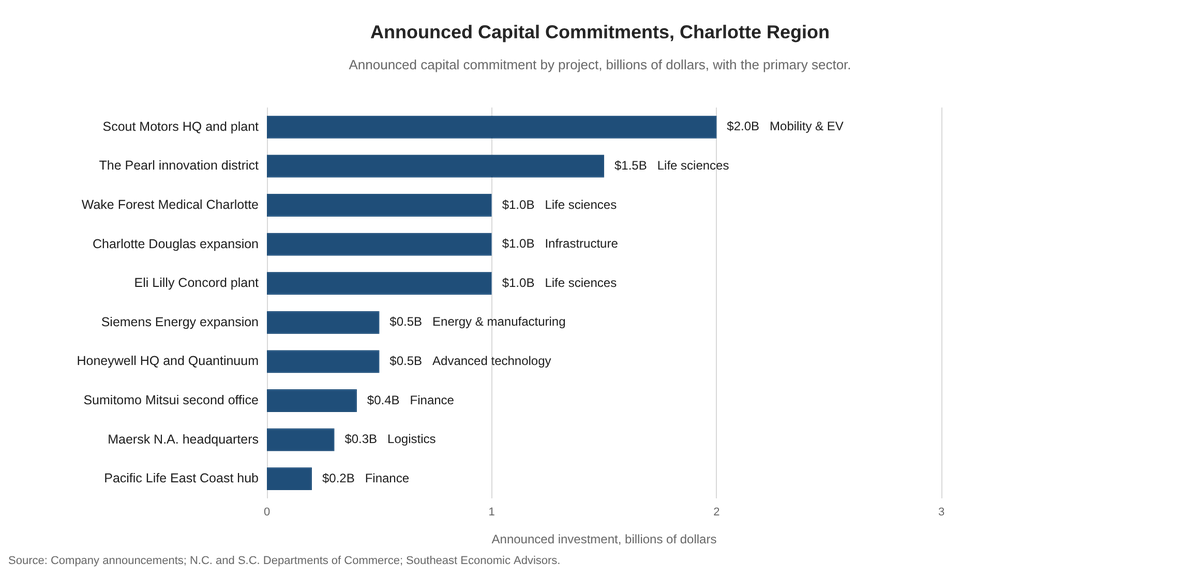
The comparison that comes to mind is life sciences, and it is instructive in the opposite direction from the obvious reading. National lab vacancy is 23.2% and construction has fallen roughly 88% from its 2022 peak, and Raleigh-Durham lab vacancy went from 8.7% in 23Q2 to 18.1% on the delivery of vacant speculative buildings of 100,000 square feet and larger. Defense space, by contrast, is built to suit and preleased. COPT Defense, the one dedicated public owner of the product, runs 95.1% occupancy across 23.3 million square feet on a pipeline that is 73% preleased.
You cannot overbuild a product nobody builds on speculation, and you also cannot develop much of it.
The trap is not the shell but the secure fit-out, where SCIF construction runs $350 to $1,000 a foot and accreditation takes twelve to eighteen months. Underwrite the shell as generic and the secure space as stranded. The repositioning of defense is an opportunity for Charlotte, but it will require a concerted effort by policymakers and economic development teams. The region is already doing that work in the adjacent sector. The Charlotte Regional Business Alliance counts 160 life sciences firms and 12,400 employees already here, and a Deloitte study it commissioned, released this month, points at medical technologies and manufacturing-related services as the clearest opportunities, with biologics, nutrition and consumer health behind them. That is the correct instinct. Charlotte's advantage in defense and in life sciences is the same one, which is a manufacturing workforce and buildings that can be fitted out, not a research campus.
The Forecast
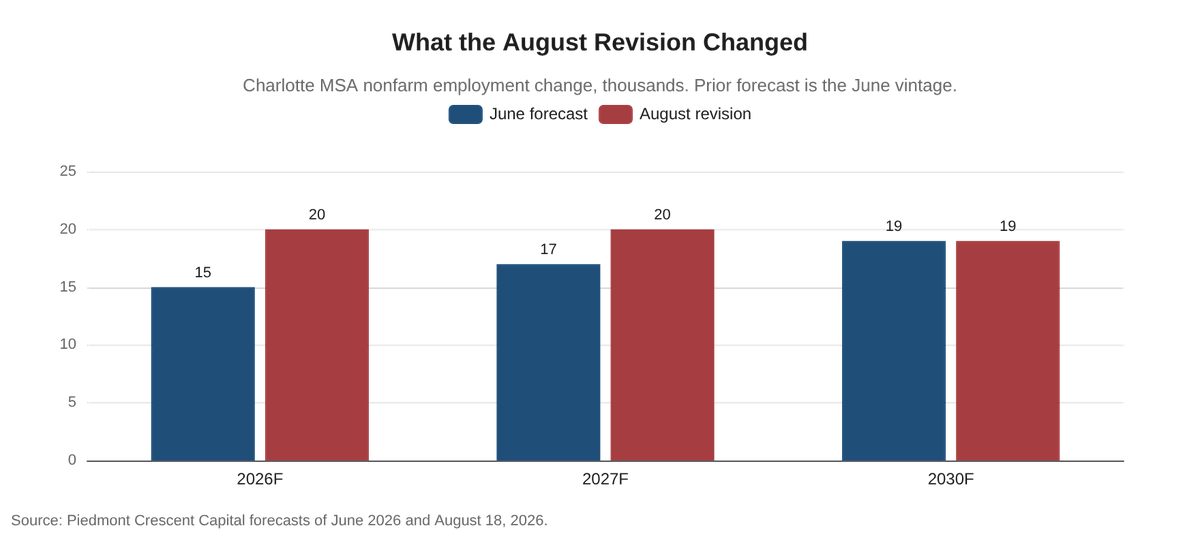
We revised this forecast up on August 18, and the revision is the news. Charlotte real GDP grows 3.9% in 2026 and holds near that pace through 2030, well above the 2.5% we carry for the United States this year. Nonfarm employment growth troughed at 0.9% in 2025 and recovers to about 1.4% a year, or roughly 20,000 jobs. The unemployment rate holds between 3.7% and 3.8% rather than drifting toward 4%. The prior forecast was too conservative on this year, and every year after it now compounds off a stronger base.
| Line | 2024 | 2025 | 2026F | 2027F | 2030F | 2028-2030F |
|---|---|---|---|---|---|---|
| Real GDP growth (%) | 3.6 | 3.8 | 3.9 | 4.0 | 3.8 | 3.9 |
| Nonfarm employment growth (%) | 1.5 | 0.9 | 1.4 | 1.4 | 1.3 | 1.4 |
| Nonfarm employment change (000s) | 21 | 13 | 20 | 20 | 19 | 20 |
| Total population (millions) | 2.88 | 2.94 | 2.99 | 3.04 | 3.16 | — |
| Population growth (%) | 2.1 | 2.1 | 1.8 | 1.5 | 1.3 | 1.5 |
| Population change (000s) | 60 | 60 | 53 | 46 | 41 | 45 |
| Unemployment rate (%) | 3.6 | 3.8 | 3.8 | 3.7 | 3.8 | 3.8 |
| Median household income ($) | 85,900 | 88,900 | 91,834 | 95,140 | 105,687 | — |
| Median home price growth (%) | 4.8 | 2.4 | 2.8 | 3.3 | 3.6 | 3.4 |
| Median price of existing home ($) | 425,000 | 435,000 | 447,180 | 458,360 | 505,736 | — |
| Case-Shiller home prices (%) | 5.5 | 3.0 | 1.4 | 2.5 | 3.4 | 2.8 |
What This Means, Depending on Where You Sit
Every section above points at the same practical conclusion, and it lands differently depending on which side of a deal you sit on. Charlotte has stopped behaving like one market. Metro-wide averages have become poor proxies for what is happening on the ground, so the work has to run at the submarket level and at the building vintage. A vacancy rate that describes Charlotte as a whole can hide a submarket well ahead of it or well behind it, and the deals being negotiated right now are being won and lost at exactly that level of detail.
- Investors and owners. Cap rates do not compress from here, so value has to come out of net operating income rather than out of the exit. That makes the demand question a share-of-inventory question rather than a square-foot question. The Airport submarket ranks third in office on square feet absorbed and ninth once you correct for the fact that it is a 14.4 million square foot base.
- Lenders and credit. The thin pipeline is the collateral protection. Office is building at 0.6% of stock, retail at 0.9% and industrial at 2.4%, so supply risk over a five-year hold is modest in four of the five property types. The exception worth sizing is the 2028 industrial lease expiration peak of 10.8 million square feet.
- Developers. A 6.60% mortgage and current construction costs are why almost nothing is starting. Conversion is where the math works: the Brooklyn & Church redevelopment is delivering at a basis roughly 20% below new construction, which is why eight uptown conversions are underway and one office tower is.
- Leasing, on both sides of the table. The relevant comparison is the submarket and the vintage, not the market. Office vacancy runs 19.6% in 4 & 5 Star buildings and 4.3% in 1 & 2 Star, and a renewal negotiated off the 13.1% metro figure is negotiated off a number that describes neither building. Industrial tenants rolling in 2028 should start early, because a lot of them roll at once.
- Investment sales and brokerage. Net absorption in square feet is what every market report leads with, and it mostly measures how large a submarket already is. Uptown ranks ninth on square feet and third on demand. Bringing both numbers to a pitch is a better argument than bringing the flattering one.
- Appraisal and valuation. Three respected houses put Charlotte office vacancy at 13.1%, 23.9% and 26.4% in the same quarter, because each measures a different inventory universe. A comparable is only valid inside one of them, and the file should say which.
- Property and asset management. Concessions are the real apartment rent right now. Asking rents fell 0.9% over the year and effective rents fell 2.4%, with up to ten weeks free in new lease-ups. Concessions burn off before asking rents turn, so the spread between the two is the leading indicator on the operating budget.
- Legal counsel. Entitlement is the binding constraint in the fastest-growing part of this region, and a nine-month moratorium in the Indian Land panhandle moves a delivery date further than a rate cut would. The defense and advanced manufacturing incentive agreements are underwritten on job counts, wage floors and clawbacks rather than on square footage, and several carry multi-year performance tests before the first dollar is paid.
- Accounting, tax and audit. Conversion changes the asset, not just the tenant. About 2.6 million square feet is leaving the office denominator and coming back as apartments, hotel rooms and student housing, which carries different depreciation lives, different treatment and different exit assumptions than the building it replaced.
- Economic development. Defense is the opportunity in this cycle and it will not develop itself. The buildings are ordinary industrial buildings, so the trap is the secure fit-out, where SCIF construction runs $350 to $1,000 a foot and accreditation takes twelve to eighteen months. That is a site selection conversation, not a leasing one.
- Corporate occupiers. The constraint on growth here is wage pressure rather than space. Recruiters report roles that paid about $170,000 three years ago now clearing $230,000 with retention bonuses, against a Mecklenburg County average of $90,706.
What We Would Watch Through 2027
- Office: whether the availability rate keeps falling. CoStar has availability at 12.6% against 13.1% vacancy, an unusual gap.
- Industrial: whether the 9.7 million square feet underway delivers into preleases or into vacancy. That decides whether the 9.9% vacancy rate holds.
- Apartments: the spread between asking and effective rents. Effective rents are falling 1.5 points faster than asking rents, and that gap closes before the headline turns.
- Retail: whether anything gets built at all. A 3.3% vacancy rate and 4.3% rent growth should be pulling in development, and a 6.60% mortgage and current construction costs say no.
- Hotels: whether the quarter beats the year again. Hotels reprice nightly, so the turn shows up here first.
Governing all five is the cost of capital. Our base case has the next Federal Reserve move as a hike in the first half of 2027, and possibly as early as December of this year, with the 10-year Treasury at 4.60% at year end and the 30-year mortgage at 6.60%.
If we are wrong and the Fed cuts, everything in this report gets better at once, which is precisely why it should not be underwritten.
Mark P. Vitner – President & Chief Economist, Piedmont Crescent Capital
mark.vitner@piedmontcrescentcapital.com · (704) 458-4000
Sources: CoStar market reports for Charlotte, NC, 26Q2, licensed to Piedmont Crescent Capital; U.S. Bureau of Labor Statistics, Metropolitan Area Employment and Unemployment, June 2026, and the Charlotte area economic summary of August 3, 2026, not seasonally adjusted; U.S. Census Bureau; CBRE and JLL life sciences figures, first quarter 2026; COPT Defense second quarter 2026 results; N.C. and S.C. Departments of Commerce; the Charlotte Business Journal; The Charlotte Ledger; Cushman & Wakefield; company announcements. The composite demand score, the size adjustment and the submarket crosswalk are Piedmont Crescent Capital calculations and are not CoStar products.
Disclaimer: This report is provided for informational purposes only and does not constitute investment, legal, tax, or accounting advice, nor an offer or solicitation to buy or sell any security. Information is drawn from sources believed to be reliable, but its accuracy and completeness are not guaranteed. Views expressed are those of the author as of the date of publication and are subject to change without notice. Past performance is not indicative of future results.