
The Week Across the South
The Fed hikes for the first time since 2023 on a unanimous vote and a hawkish dot plot, the Census Bureau's new income and poverty report tests a common perception about the South's wage gap, a three-month view of state payrolls turns the region's soft-spot story upside down, with Virginia, Georgia and the District of Columbia lagging the nation while Florida, Alabama and Oklahoma keep pace or better, and a year-to-date look at Southern single-family housing permits complicates a growth story we expected to tell differently.
At a Glance
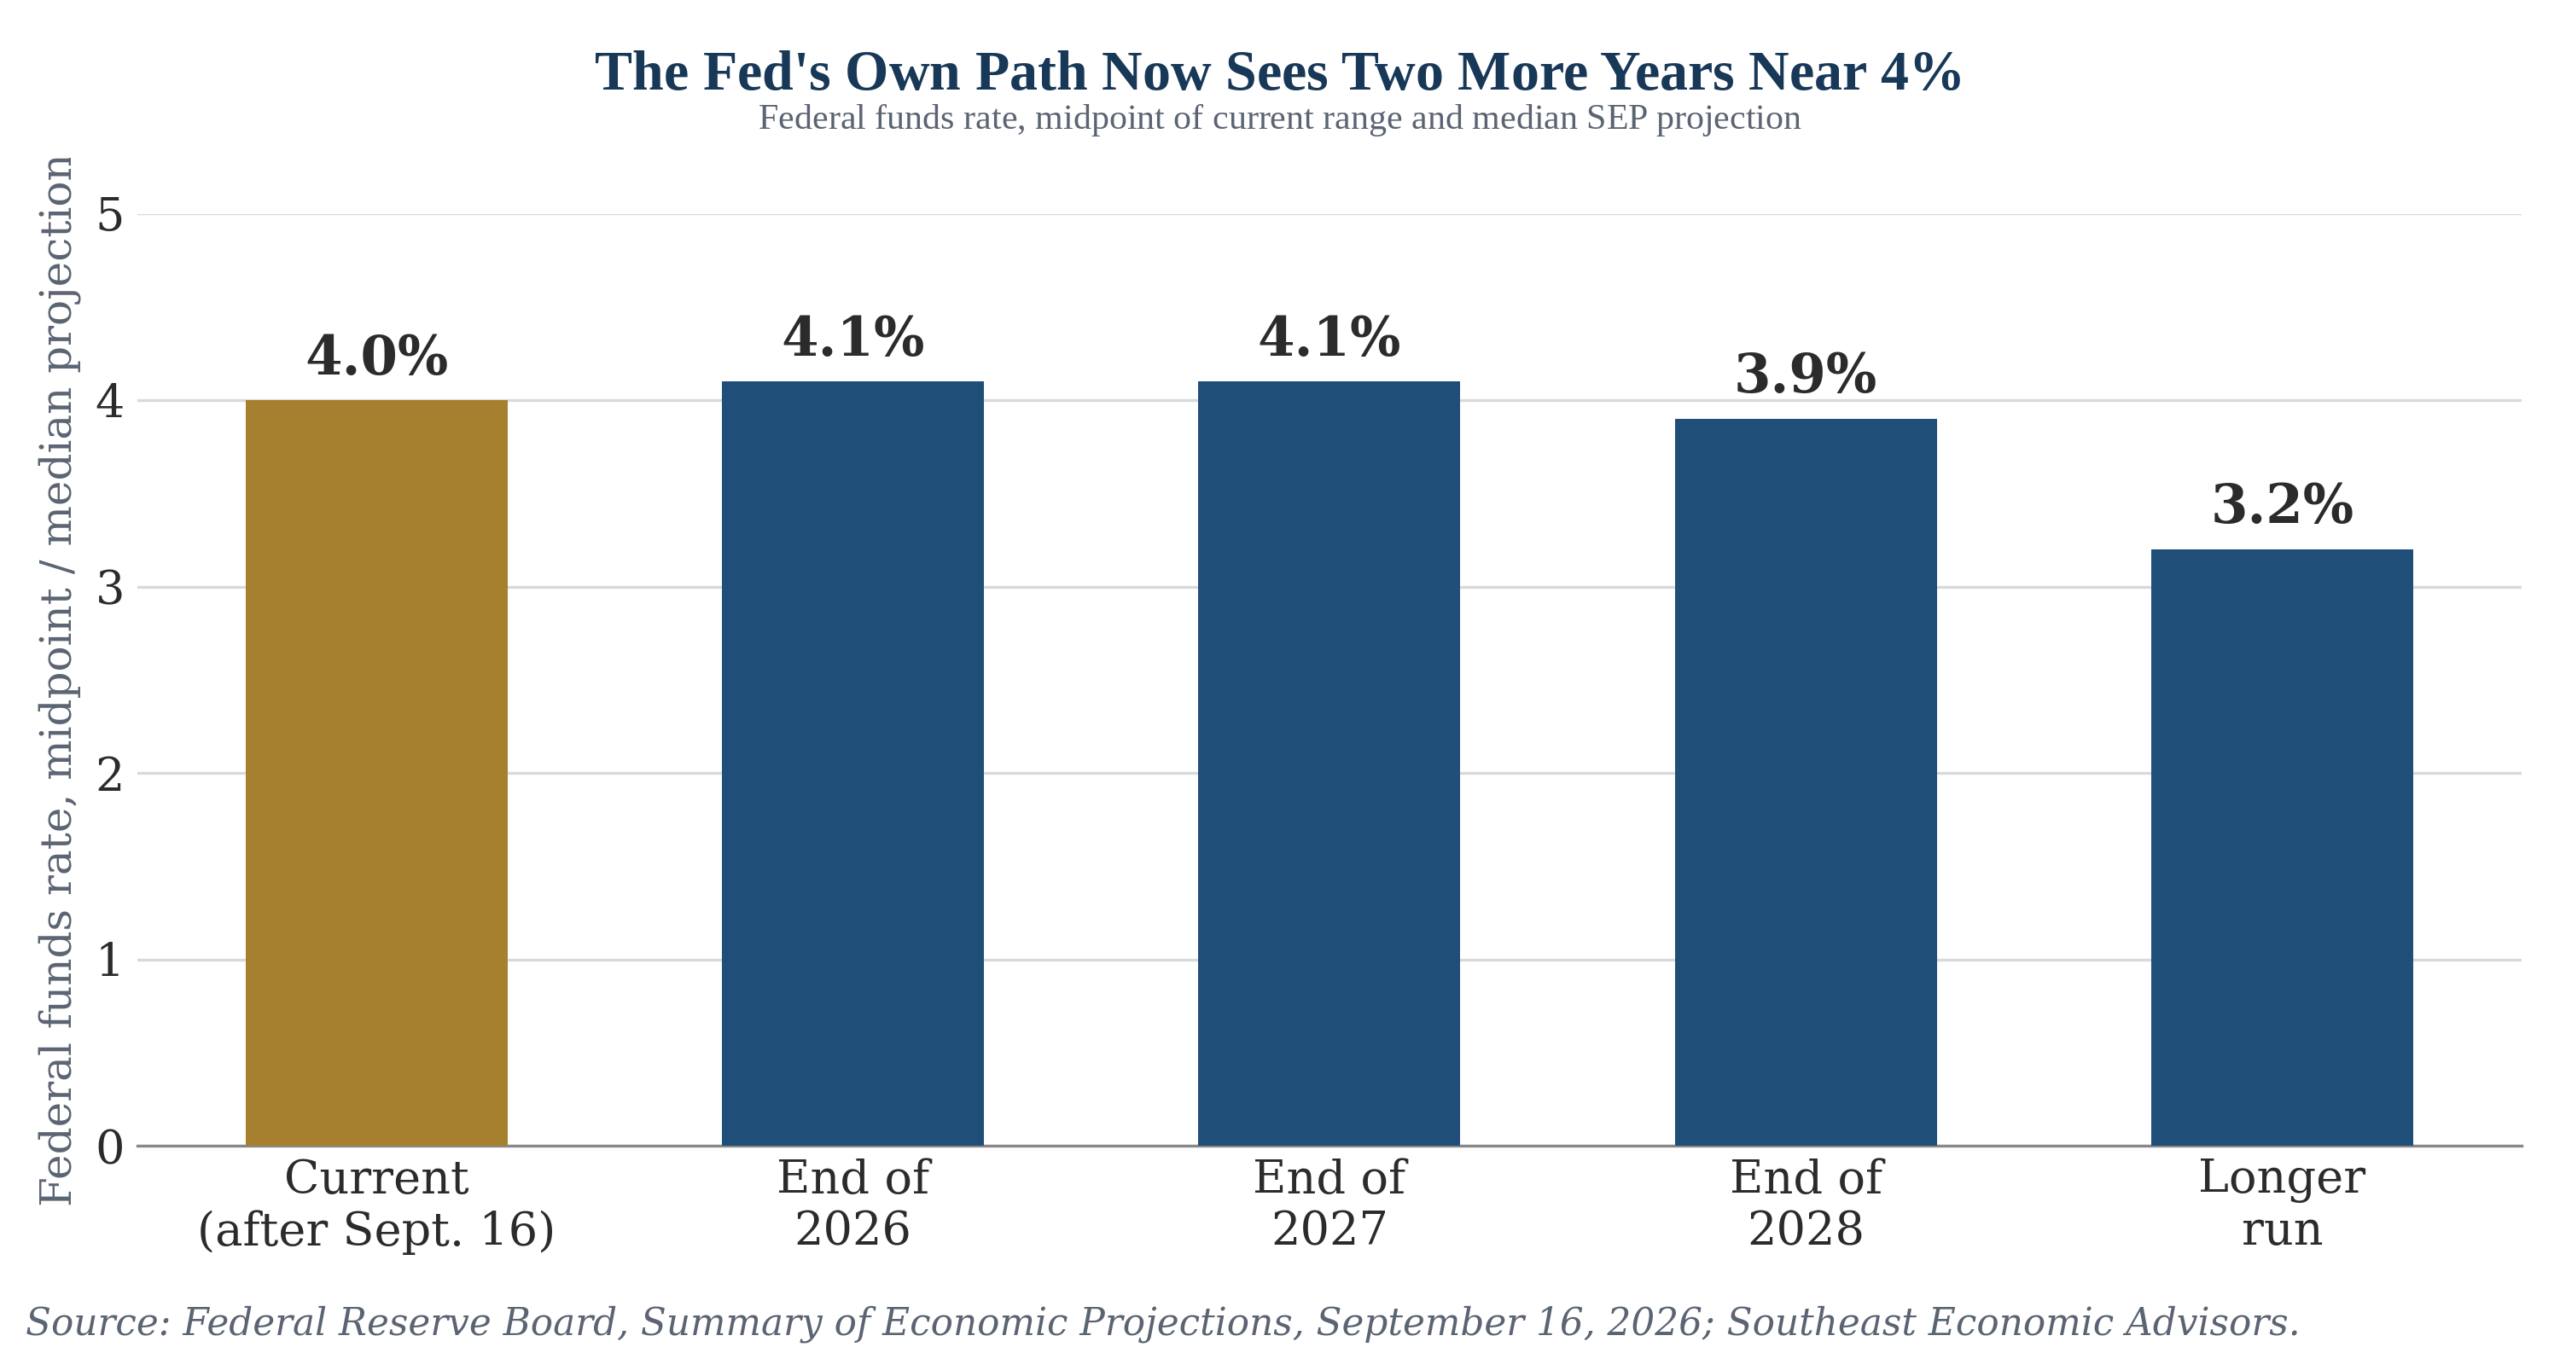
- The Fed raised its target range a quarter point on September 16, its first increase since 2023, on a unanimous 12-0 vote, with the Summary of Economic Projections now showing a median 4.1% federal funds rate for both the end of 2026 and the end of 2027.
- The ten-year Treasury's rise since September 1 is a real-yield story, not an inflation-expectations one: the real yield rose 24 basis points while breakeven inflation actually fell.
- 2025 median household income hit a record $87,460 nationally, and the South's income gap with the Midwest converged for the first time in at least two decades — though its poverty rate did not.
- August's state employment data flip the usual reading of who is leading growth in the South: Louisiana, South Carolina, North Carolina, Texas, Missouri and Alabama are outgrowing the nation, while Georgia, Kentucky, Maryland and Virginia are shedding jobs.
- A year-to-date look at Southern single-family housing permits complicates a growth story we expected to tell differently — only two of nine major Southern and Sun Belt metros are running ahead of last year's pace through July.
- This week's football preview, Georgia Tech at Stanford, carries the fuller comparison of Atlanta's and the Bay Area's tech-anchored metro economies.
The Federal Reserve raised its target range a quarter point on September 16, its first increase since 2023, on a unanimous 12-0 vote that our own flip rule did not call. August core CPI cleared the rule's 0.3% threshold but core goods rose just 0.1%, well short of the 0.4% bar we said a September increase required, which by our own framework argued for a hold. The Committee moved anyway, for the reason we flagged in the prior issue of A View from the Piedmont: a Committee protecting the credibility it spent August building, and an oil-driven inflation risk playing out over eighteen months rather than one month of goods prices. Chair Warsh called inflation "too high, and has been for too long" and declined to pre-commit to the next move. The Summary of Economic Projections was the more hawkish signal: sixteen of eighteen participants see at least one more increase this year, with the median fed funds projection at 4.1% for both the end of 2026 and the end of 2027, in line with our own 4.00% to 4.25% terminal call but arriving on a faster path than we had penciled in. The two-year Treasury reached 4.744%, a two-year high, and the ten-year touched 5.041% intraday Tuesday, its highest since 2007, before settling near 4.998% by Friday. The European Central Bank raised to 2.50% on September 10 on the same energy channel. We now weigh a second increase before year-end as more likely than not, instead of treating the December meeting as the year's only remaining decision point; either way, Southern borrowers should plan around a 30-year mortgage rate that is higher for longer, not lower by spring.
The ten-year Treasury's rise since September 1 is a real-yield story now, not an inflation-expectations one, a reversal from the pattern running through most of August. Splitting the move the way Irving Fisher would, nominal yield as the real yield plus expected inflation, nearly all of the ten-year's climb from 4.79% on September 1 to the 5.00% to 5.01% range around the September 16 decision came from the real, inflation-protected yield, which rose 24 basis points to 2.68%, while ten-year breakeven inflation actually fell about 2 basis points to 2.33%. The September 17 ten-year TIPS reopening priced a 2.653% real yield, the highest in nearly eighteen years according to TIPSWatch, up from 2.438% at the July auction and 1.896% in March. That points to a term-premium and crowding-out story, not a fresh round of inflation fear: investment-grade bond issuance is running above $1.5 trillion year to date, up 36% from a year earlier, and borrowing by the largest technology companies now accounts for roughly a quarter of net Treasury note and bond issuance this year, competing directly with the Treasury for the same long-duration buyers. Diesel's 24.1% year-over-year rise in the Producer Price Index is a live upside risk to breakeven inflation that has not shown up in the TIPS market yet; if it does, the real-yield story becomes an inflation-expectations story too, and Southern trucking and agriculture would feel both at once.
The Census Bureau's new household income and poverty report puts 2025 median household income at a record $87,460 nationally, up 2.6% over the year and the highest since the series began in 1967, and a common perception about the South's persistent income gap does not hold up as cleanly as it should. Post-tax median household income reached $76,060, up 3.1%, though it still falls short of the 2020 and 2021 levels households received with pandemic-era stimulus and credits. The gains were not evenly shared: the 90th percentile posted a third straight year-over-year increase in both pre-tax and post-tax income, the 10th percentile did not move by a statistically significant amount, and the ratio between them widened to 13.06, the widest since the series began. The Bureau has not yet published the 2025 breakdown by region; the most recent confirmed regional figures are the 2024 American Community Survey estimates, which put the South's median household income at $76,278, statistically even with the Midwest's $76,278 for the first time in at least two decades, and both well behind the Northeast's $89,285 and the West's $92,803. Poverty did not converge in the same period. The South's 2024 rate of 13.1% remained the highest of the four regions, ahead of the Midwest's 11.8%, the Northeast's 11.5% and the West's 11.3%, so the region converged on income without converging on poverty. The intuitive explanation, that the South simply has more of its population living in lower-income rural areas, is only partly right. The 2020 Census put 24.2% of the South's population as rural, well above the Northeast's 16.0% and the West's 11.1%, but below the Midwest's 25.7%. A region that is less rural than the Midwest and now has the same median income as the Midwest is not a case where rural composition alone explains the gap; something else, most plausibly the industry mix and wage structure within both the rural and urban South, is doing more of the work than population geography. Rural households do earn less than urban ones nationally, USDA's Economic Research Service has put the gap near 25%, and rural housing costs less in absolute dollars, but the same research shows rural households carry a housing-cost burden similar to or lower than urban ones as a share of income, which cuts against the idea that Southern rural housing is disproportionately expensive relative to what rural residents earn. Industry mix looks like a better lead than population geography. A BLS-based comparison of the five largest manufacturing states in each region puts the South's manufacturing employment at 39% nondurable goods against the Midwest's 35%, a real but modest gap next to the region's textile-and-apparel-heavy past; a 2021 BLS study found Southern nondurable-goods manufacturing jobs fell 33% from 1990 to 2019 against a 7% decline in durable goods, as the region added the auto and aerospace plants that have since narrowed the gap. Durable goods manufacturing still pays meaningfully more nationally, $39.11 an hour in August against $33.17 for nondurable goods, so a South that remains several points more nondurable-heavy than the Midwest is carrying a real, if narrowing, wage disadvantage in its industrial base on top of whatever rural composition contributes.
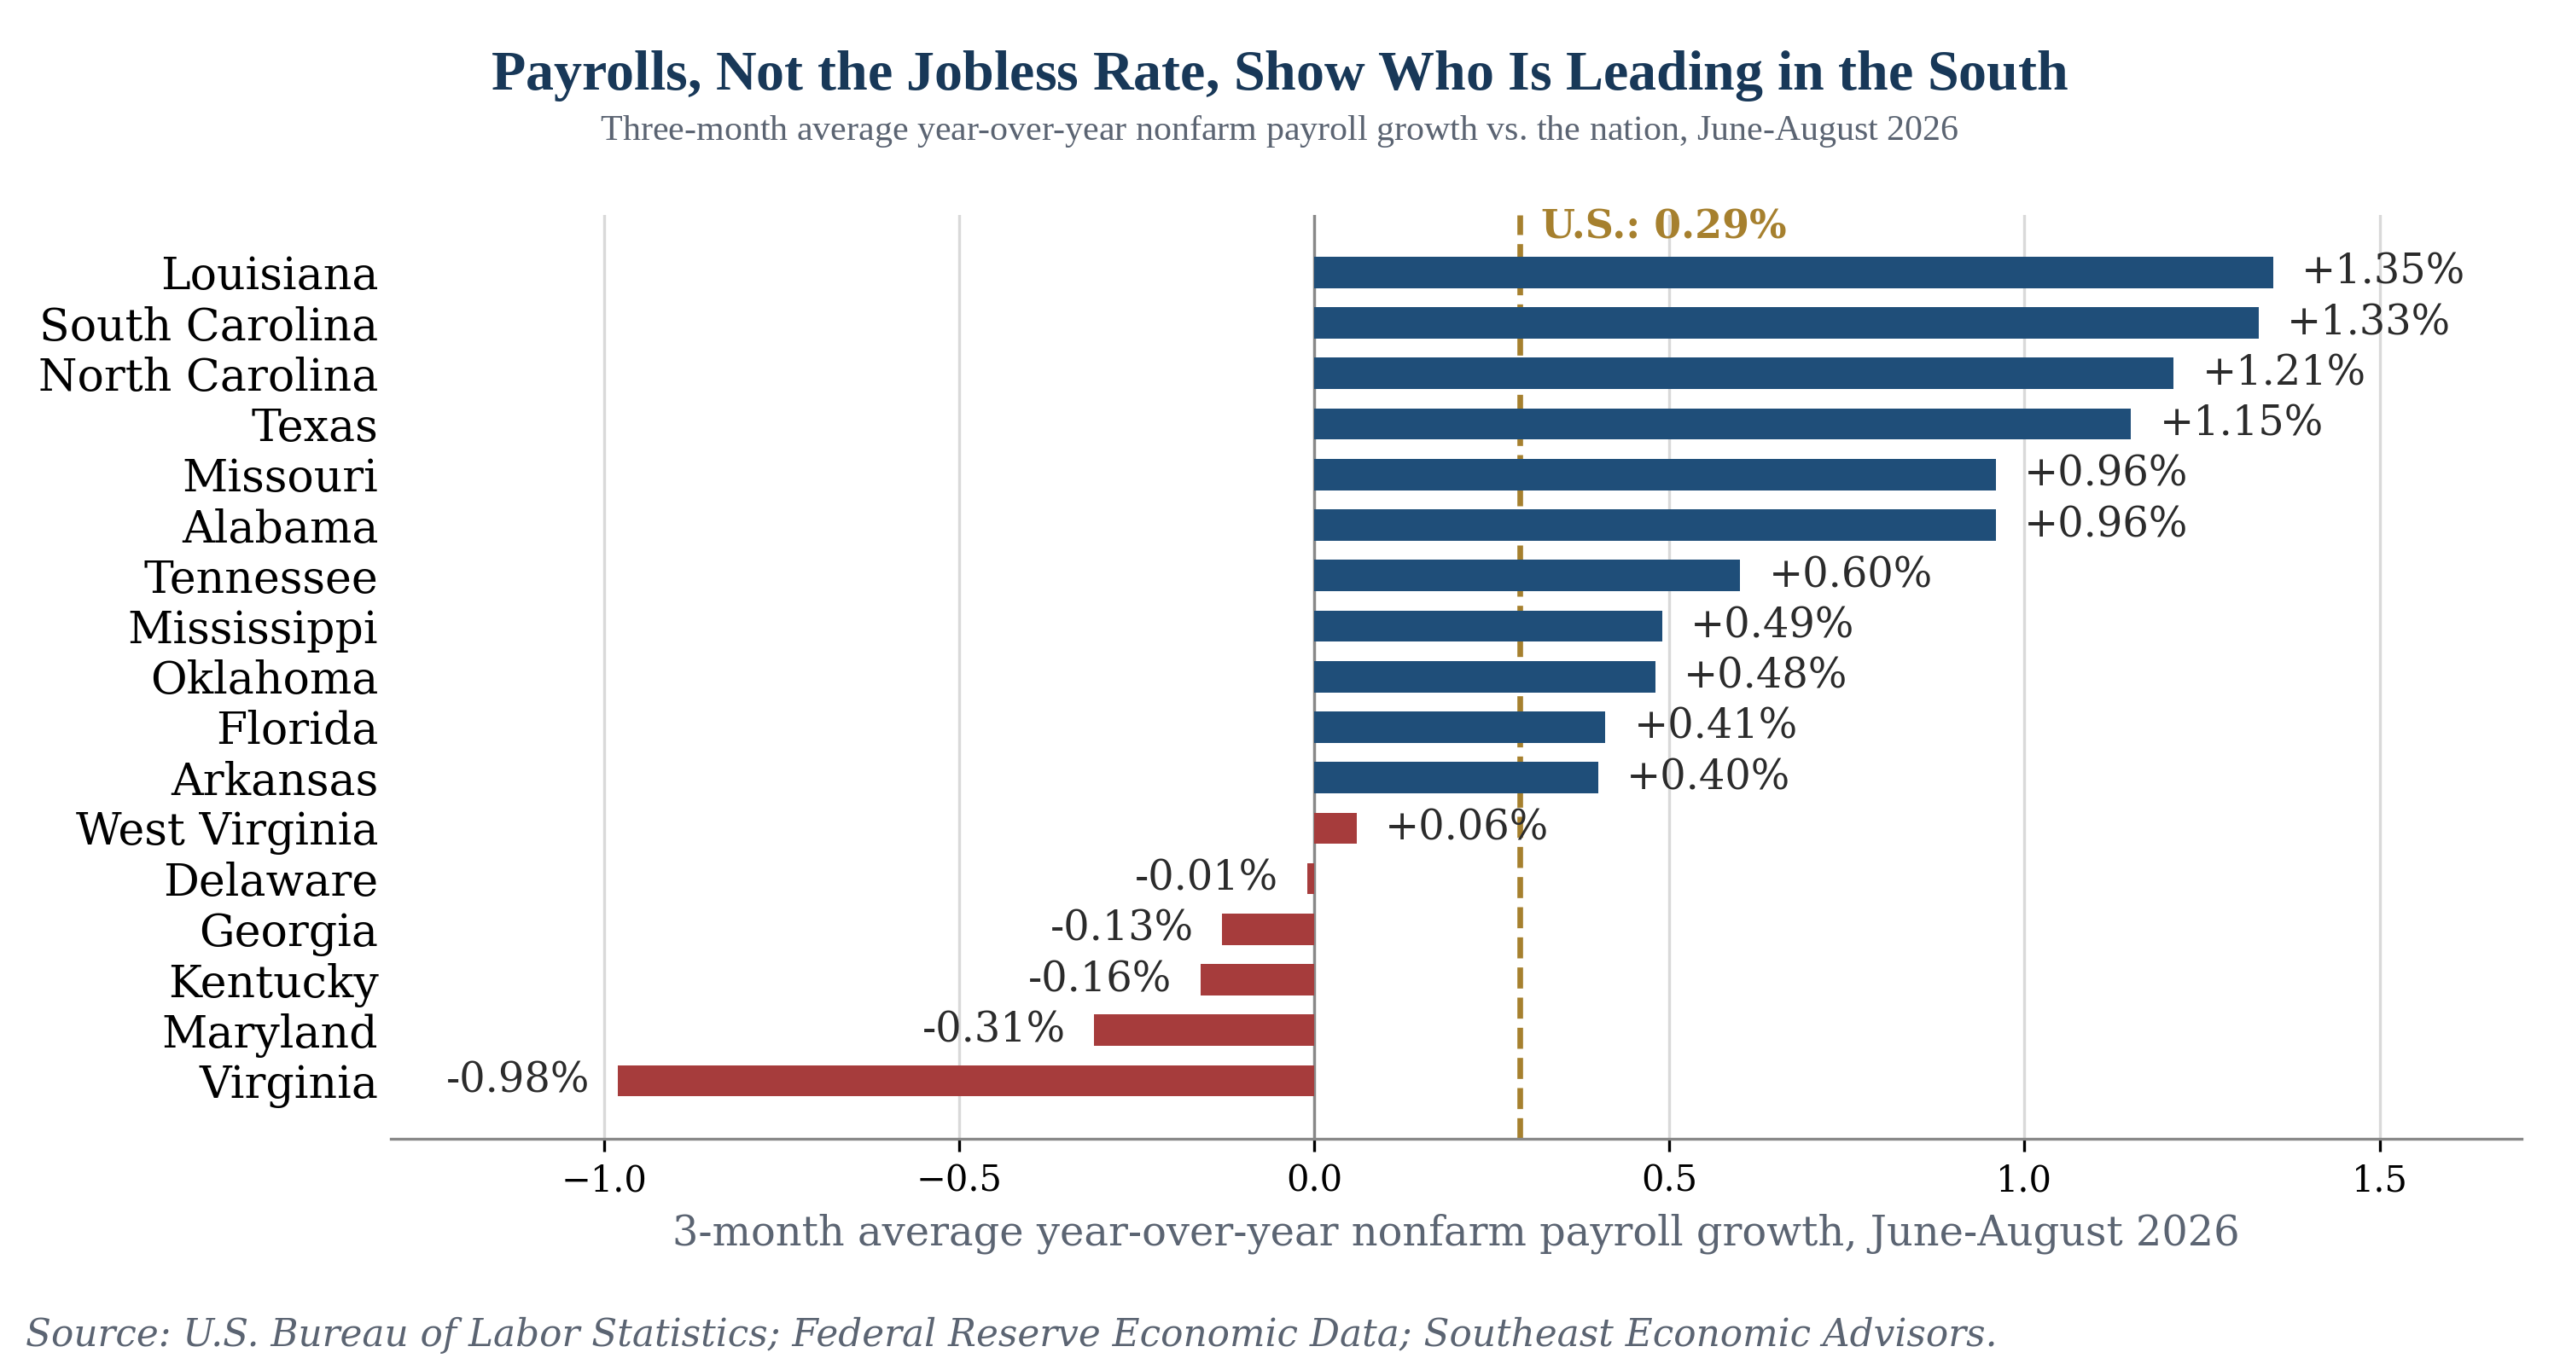
August's state employment data flip the usual reading of who is leading growth in the South. A three-month average of year-over-year nonfarm payroll growth, which smooths out the noise any single month of state data carries, shows Louisiana, South Carolina, North Carolina, Texas, Missouri and Alabama all growing more than half a point faster than the nation's own 0.29% pace. Florida and Oklahoma are also growing faster than the nation, comfortably so, even as both states' unemployment rates rose over the year. The real laggards are Georgia, Kentucky and Maryland, each losing payroll jobs against a growing national base, and Virginia, down 0.98% on the same measure, the sharpest decline in the region outside the District of Columbia, whose payrolls fell an average of 4.25% over the same three months. We walk through the full ranking, and why Florida's own rising unemployment rate, unlike Alabama's or Oklahoma's, is the one in the region actually worth watching, in Labor Markets below.
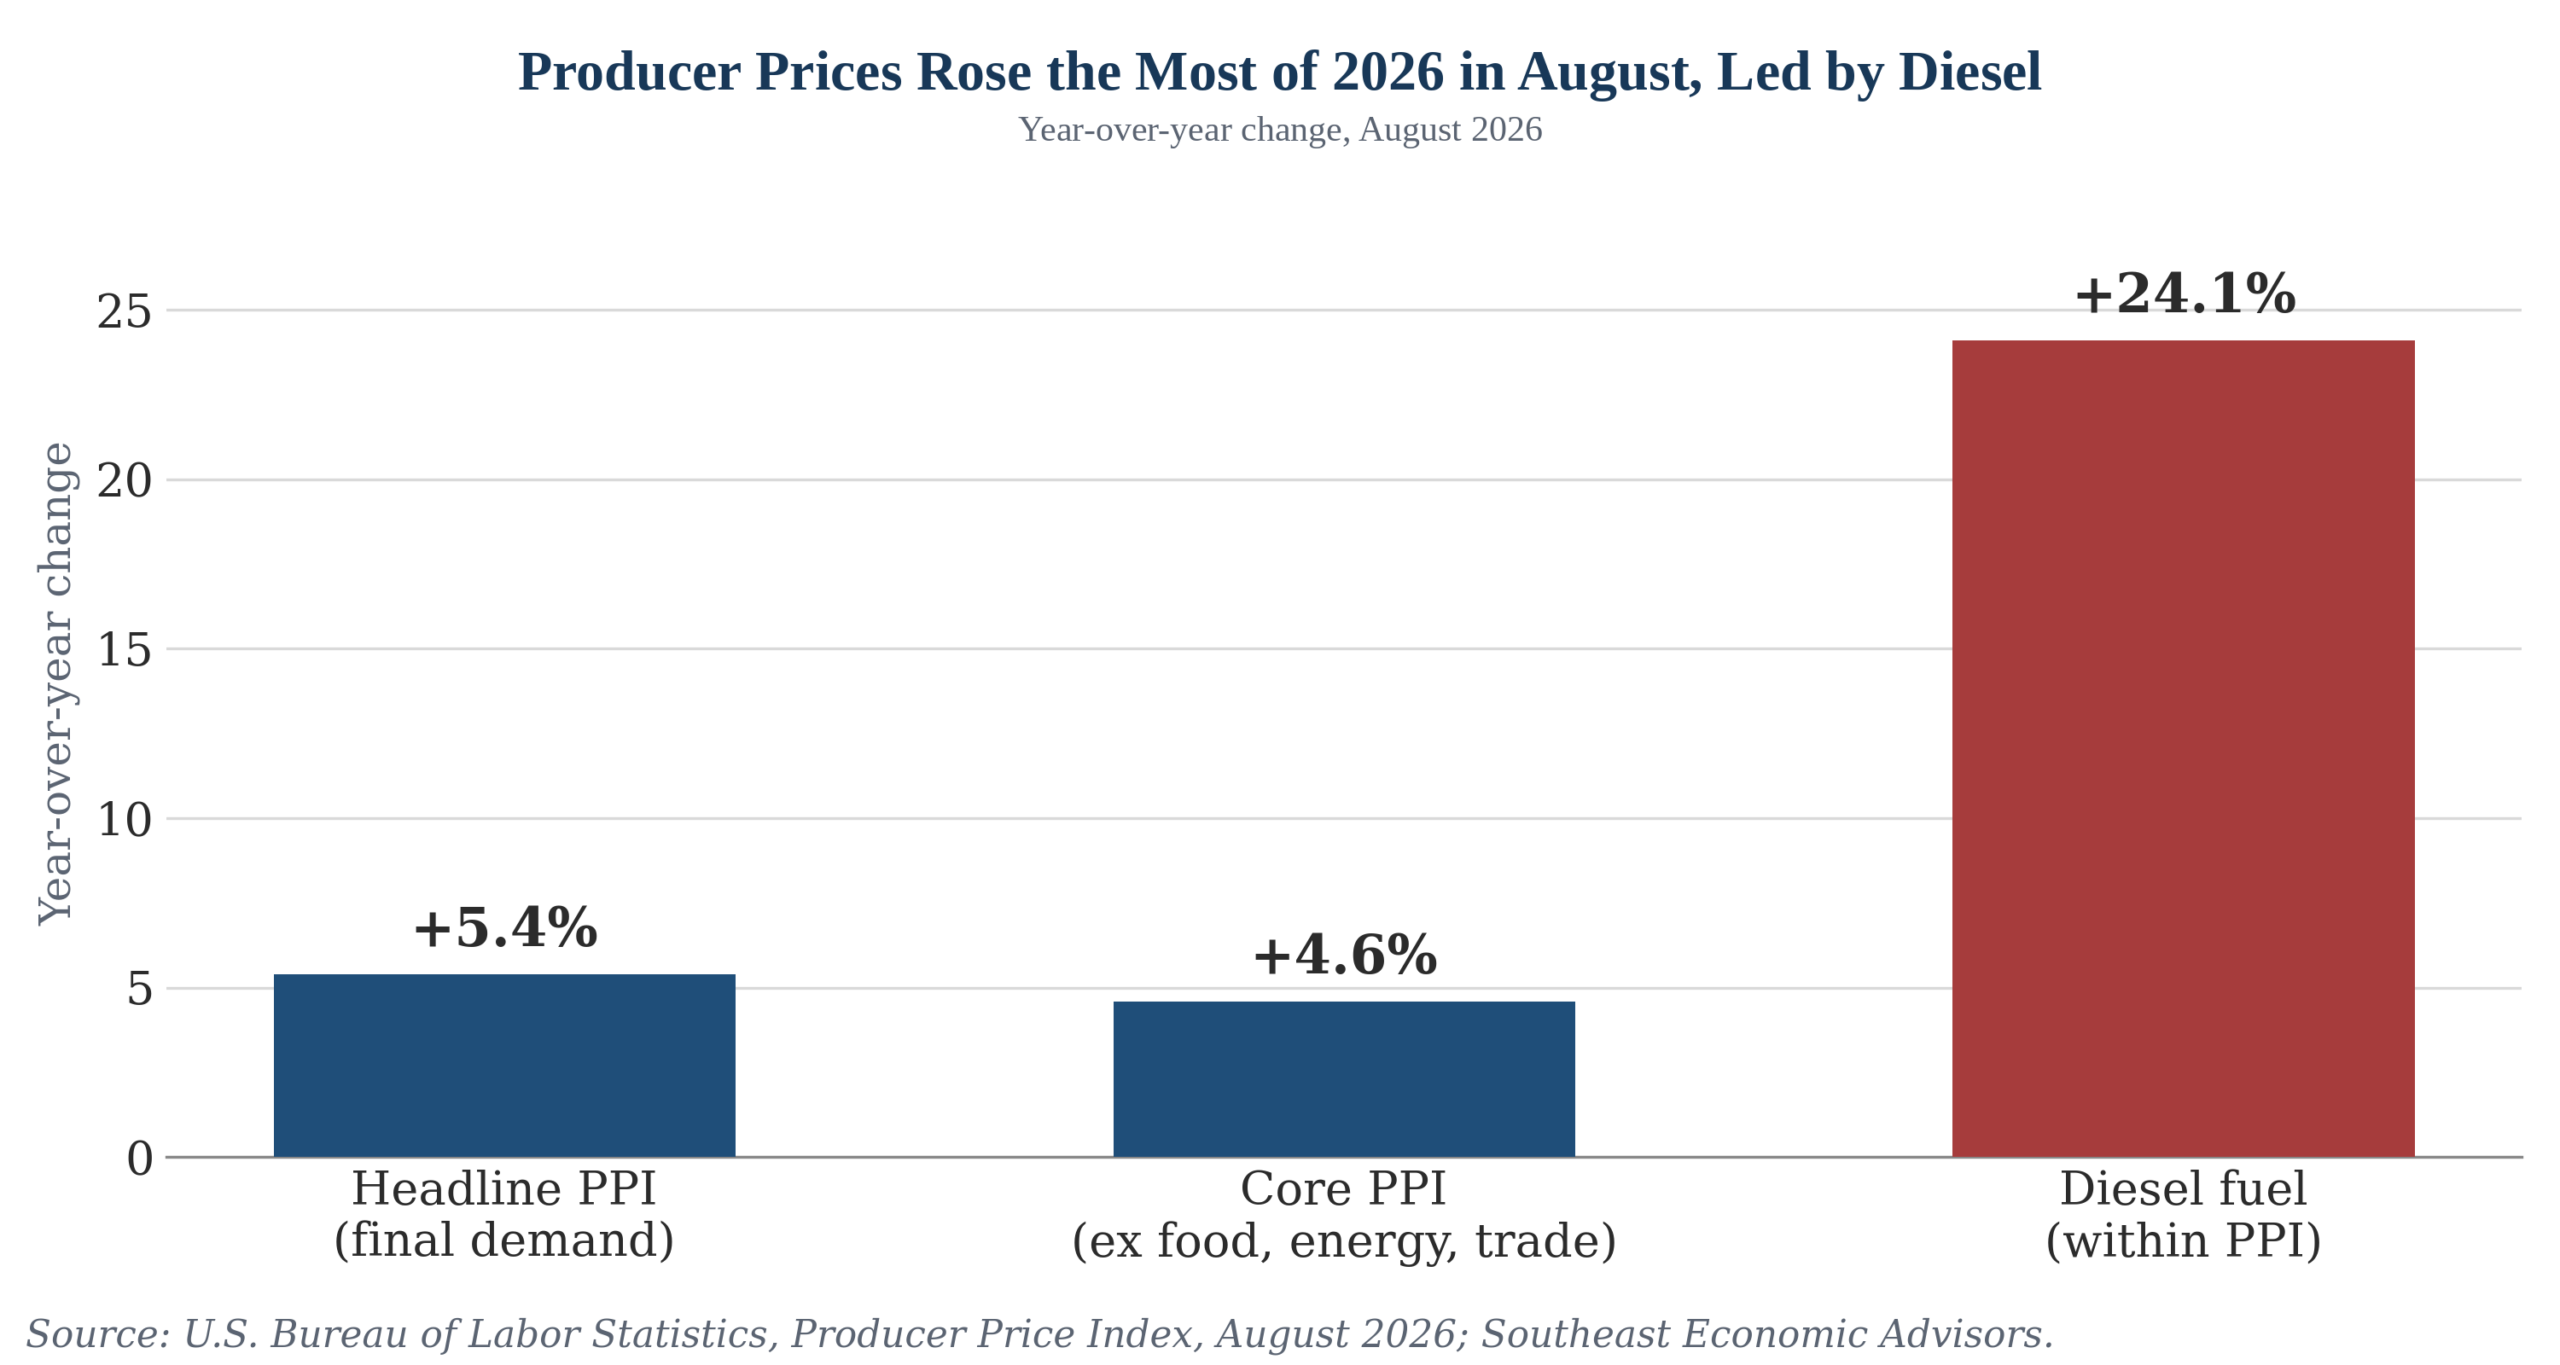
Put together, the region enters the fourth quarter carrying higher borrowing costs, a wage story that is more complicated than a rural discount, and a data-center policy fight that has gone from a sprint to a walk. Local governments took four confirmed actions on data-center siting in the fourteen days after September 8, Putnam County, Florida approved a moratorium, Jasper County, South Carolina passed a first reading, Colleton County, South Carolina adopted a digital-infrastructure overlay and Prince William County, Virginia's planning commission recommended a narrower by-right window ahead of a board vote today, against eleven actions in six states over the five days before that. Producer prices rose 5.4% over the year in August, the most of 2026, with diesel fuel up 24.1% within it, the same energy channel running through the CPI, the PPI and the Fed's own reasoning for hiking, and now a live risk to the breakeven inflation that has not moved on it yet. We look for the Committee to deliver a second increase before year-end instead of waiting for December alone, for Virginia's and the District's payroll softness to persist into the fourth quarter, and for the Census Bureau's 2025 regional income breakdown, expected in the coming weeks, to tell us whether the Midwest convergence is a trend or a one-year read; a South that pulls back ahead of the Midwest on the 2025 data would be the more familiar pattern re-asserting itself, and a South that holds even would be the more interesting result.
Inflation in the South
Producer prices, not consumer prices, carried the loudest inflation signal in the South this month. The Producer Price Index rose 0.4% in August and 5.4% over the year, the fastest annual pace of 2026, with the core measure, which excludes food, energy and trade services, up 0.2% and 4.6%. Diesel fuel prices within the index rose 24.1% over the year, the single largest contributor and the one most directly felt in a region that moves freight and farm output by truck. The Federal Reserve's Beige Book, released September 2, found prices rising in eight of twelve Districts, with all four Southern Districts still growing: Richmond moderately with ports expanding, Atlanta modestly with employment flat, Dallas moderately with manufacturing, banking and energy picking up, and St. Louis reporting prices had "risen at a robust pace," the sharpest language in the book. Dallas also reported that agricultural conditions deteriorated on drought, layered on top of the row-crop strain described in the July report. The ISM prices indexes, which measure how many firms report paying more, not how much more they are paying, held at elevated levels in August, consistent with price pressure that is widespread and not concentrated in one input. We look for Southern trucking, agriculture and any business that budgets diesel as a fixed cost to carry the sharpest version of this month's inflation story into the fourth quarter; a Brent price back under $90 is what would ease it. Crude moved in that direction to start this week: Brent and WTI both fell about 2% on Monday to eleven-day lows near $101.75 and $98.34, as hopes for U.S.-Iran diplomacy at this week's United Nations General Assembly and a recovery in Saudi exports through the Strait of Hormuz took some of the risk premium out of a market that had jumped on Saturday's Houthi strikes near Riyadh. Both benchmarks remain more than $10 above the level we flagged as necessary to defuse the diesel story, so we treat this as an easing, not a resolution.
Labor Markets
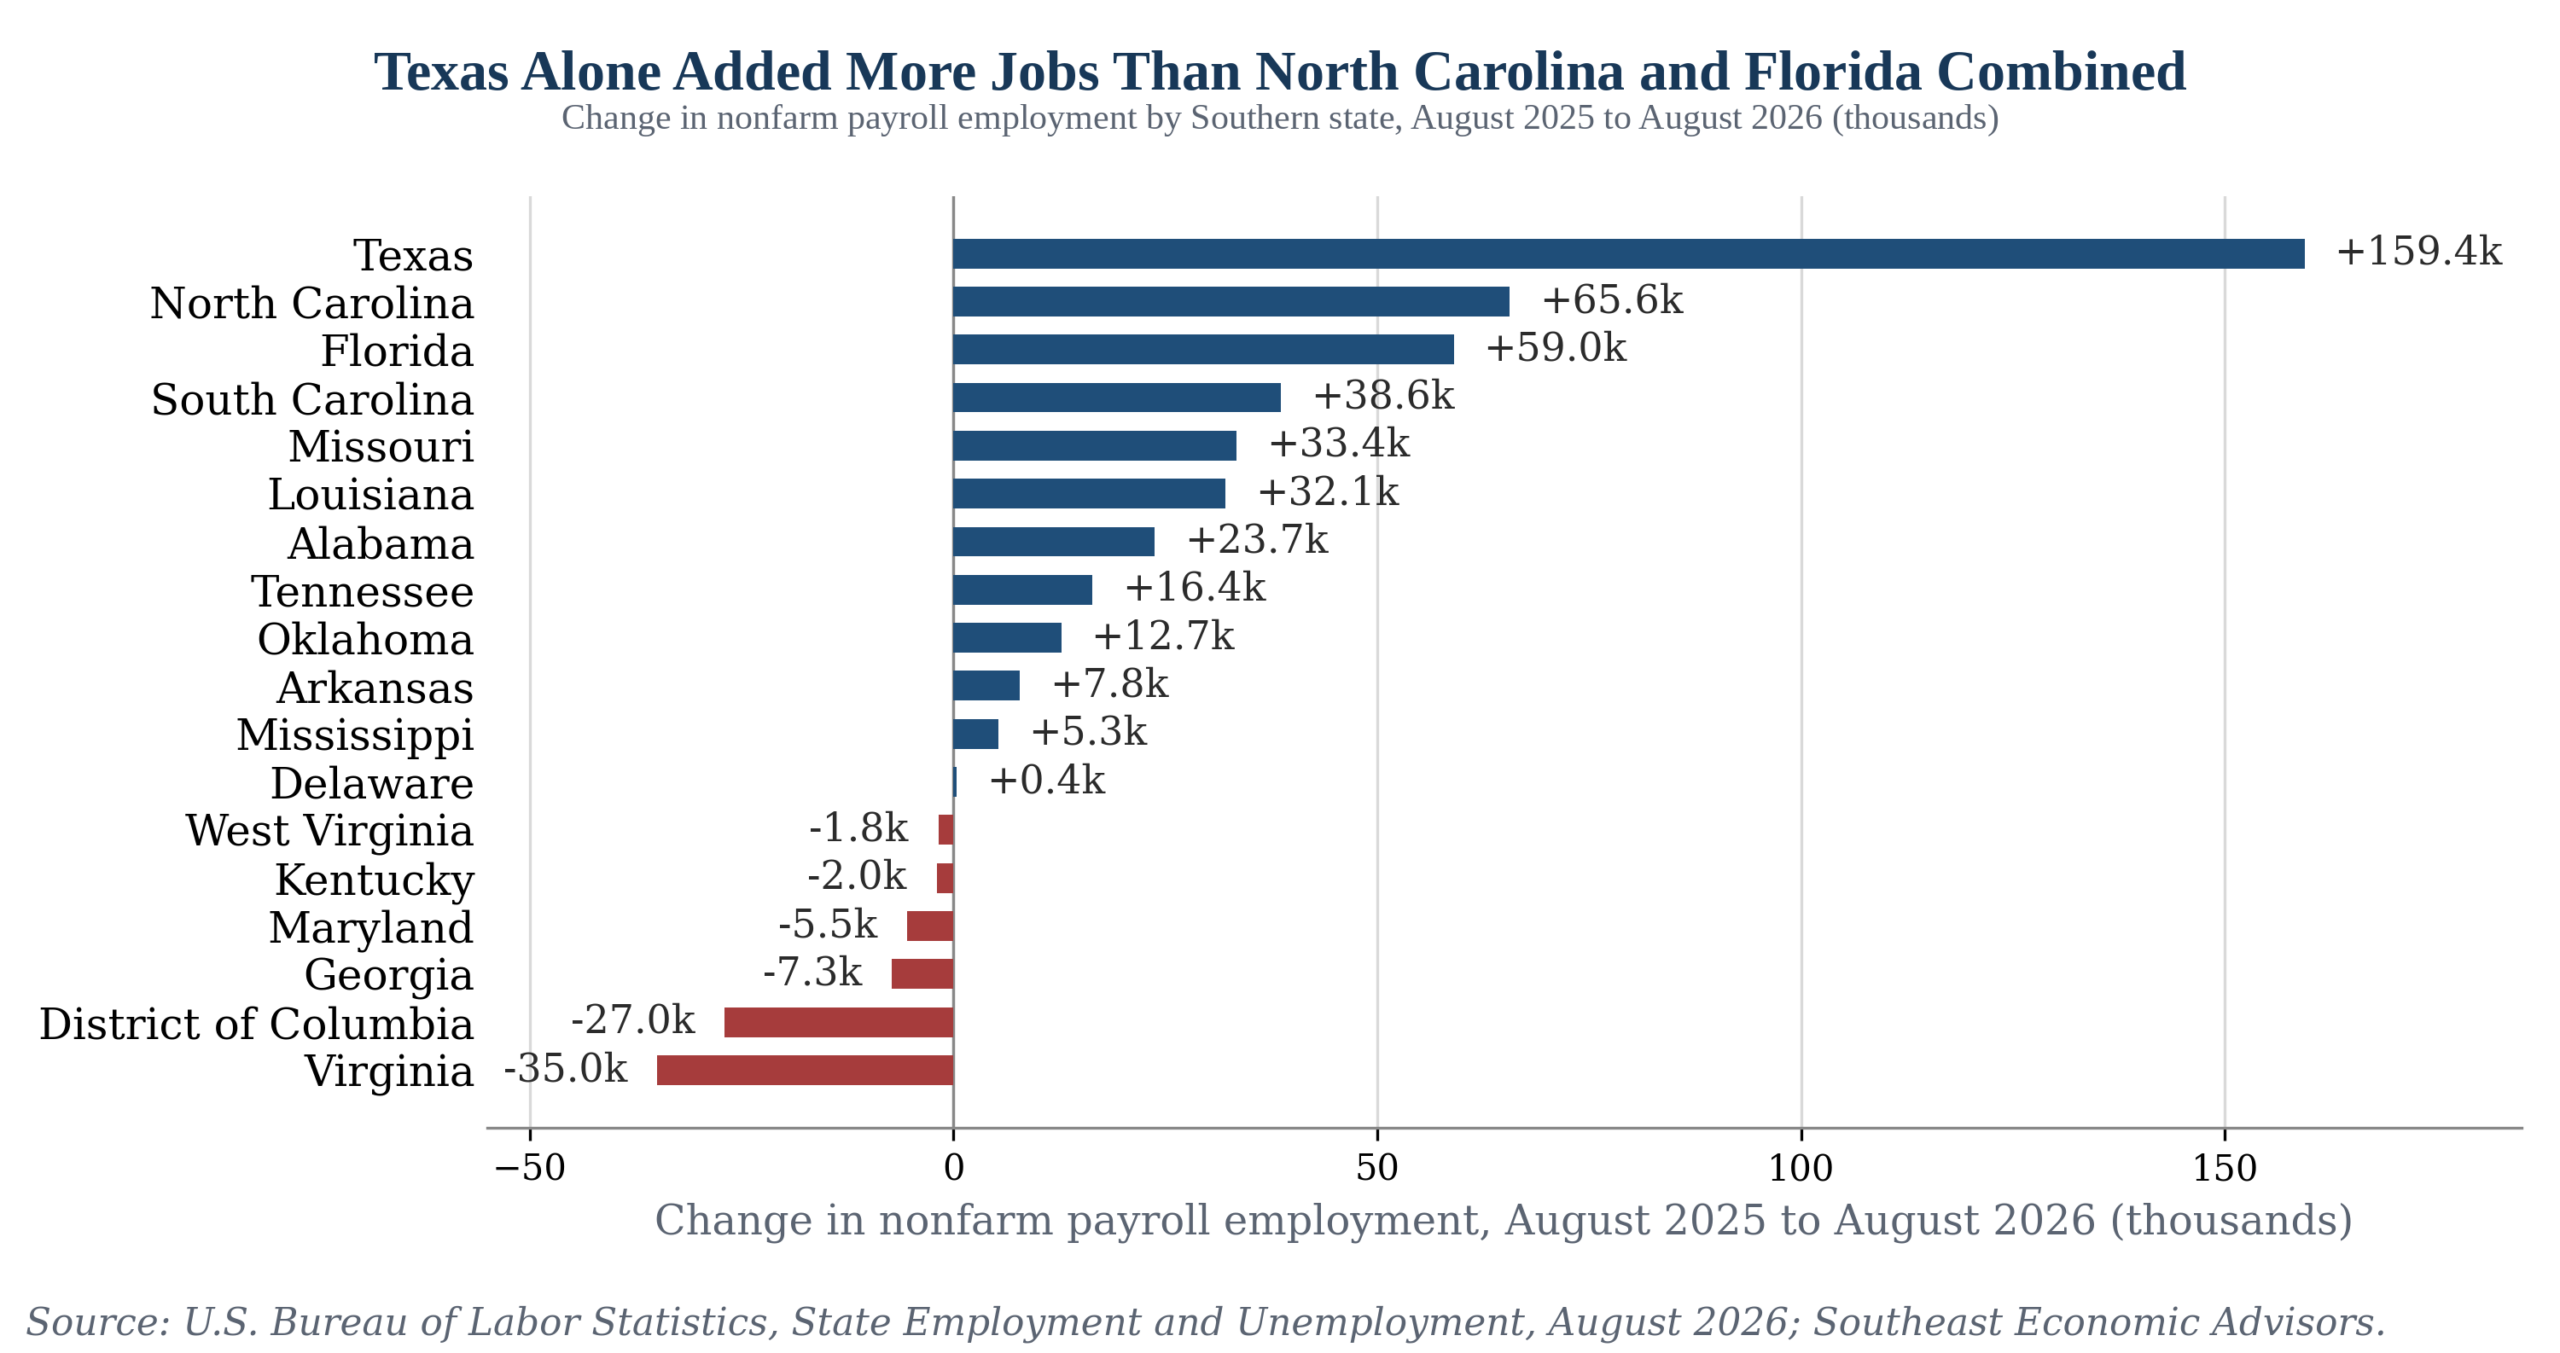
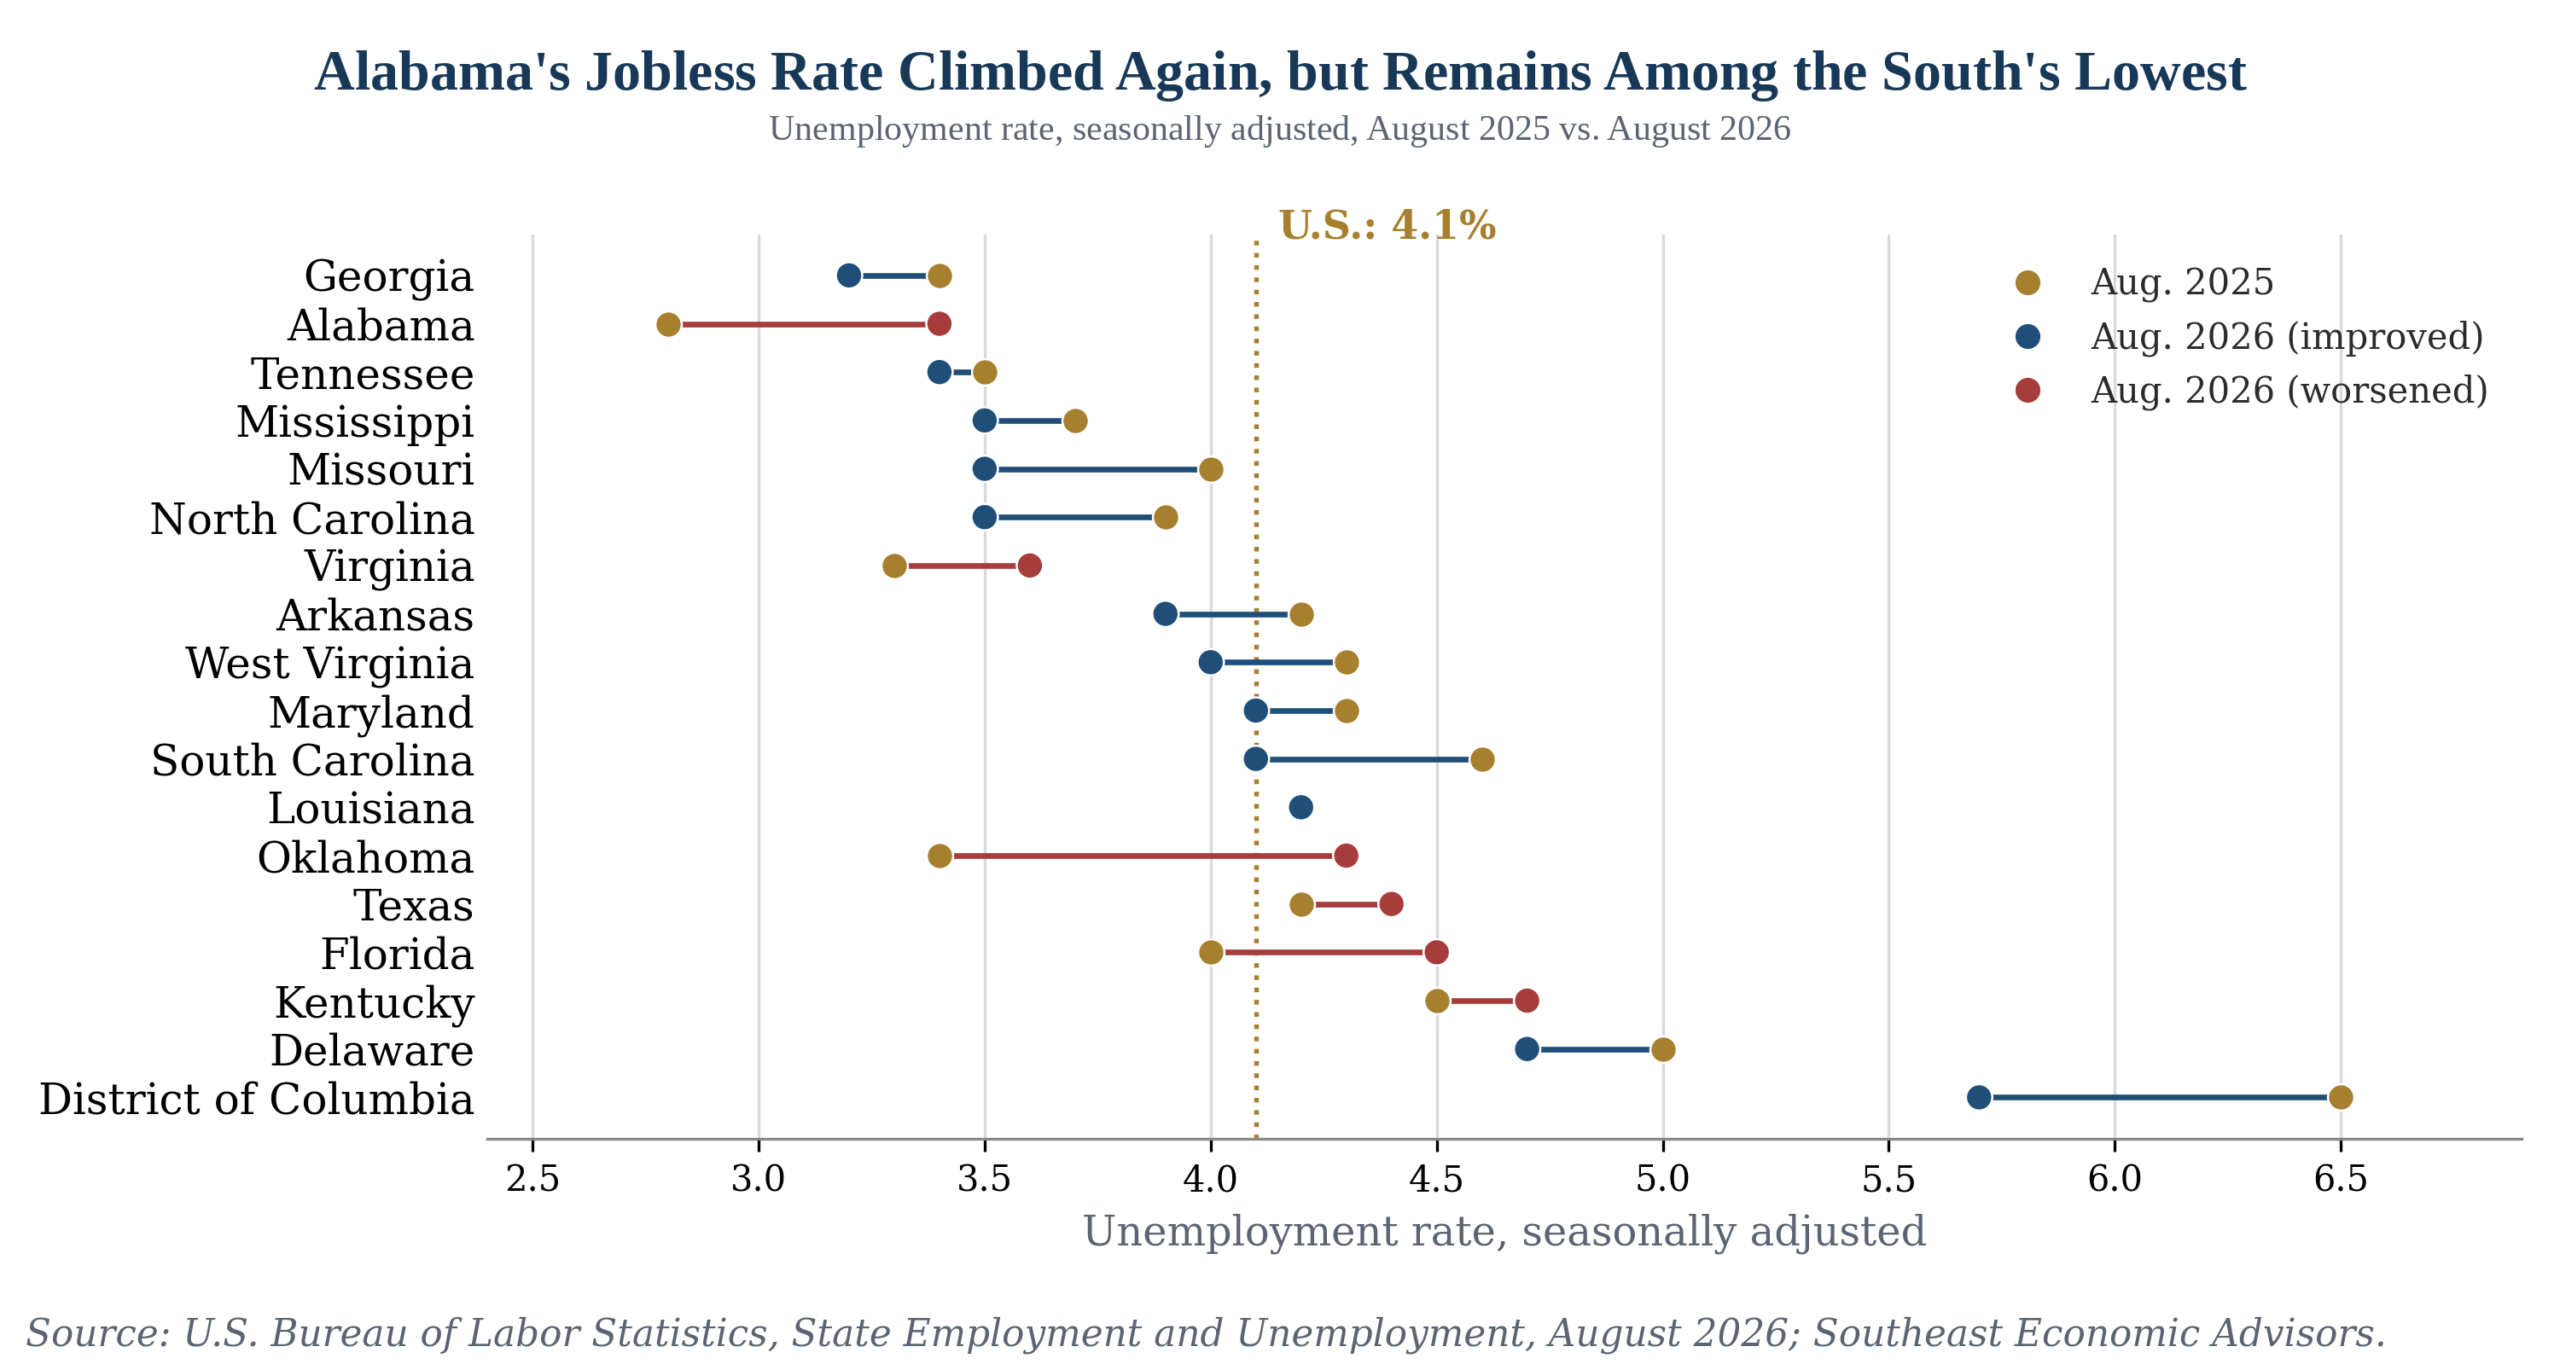
We continue to believe that nonfarm payrolls, not the unemployment rate, are the best real-time read on how a Southern state's economy is actually performing. Averaging year-over-year nonfarm payroll growth across June, July and August to smooth out the noise any single month of state data carries, six states are running well ahead of the nation's own 0.29% three-month average pace: Louisiana at 1.35%, South Carolina at 1.33%, North Carolina at 1.21%, Texas at 1.15%, and Missouri and Alabama both at 0.96%. A second tier, Tennessee, Mississippi, Oklahoma, Florida and Arkansas, is growing faster than the nation by smaller margins. West Virginia and Delaware are running close to flat, near the national pace either way. Georgia, Kentucky and Maryland are the actual laggards, each posting a small payroll decline over the three months. Georgia's softness is mostly a private-sector story, not a public-payroll one: government employment fell just 1,700 jobs over the year to August, while private payrolls fell 5,600, led by declines of 7,700 in professional and business services, 6,400 in trade, transportation and utilities and 4,000 in construction that a 19,000 gain in education and health services only partly offset. Virginia's payrolls fell 0.98%, the sharpest decline in the region outside the District of Columbia, whose payrolls fell an average of 4.25%, easing from June's 4.78% pace but still by far the worst in the country. Texas also leads the region in raw job count, adding 159,400 payroll jobs over the year, the most of any state in the country, and North Carolina's 65,600, South Carolina's 38,600 and Louisiana's 32,100 were each large enough to be one of only eight statistically significant state-level employment gains nationally, while the District's 27,000 lost jobs were the only decline. Unemployment rates remain low across most of the South, which is exactly why Florida's is worth watching: it rose half a point over the year to 4.5%, the region's third-largest increase, and it is telling us something the payroll figures alone do not fully capture. Florida was adding jobs at a 5.9% annual pace as recently as 2022, nearly two points faster than the nation's own 4.1% that year; that lead has all but closed, with Florida's three-month payroll pace of 0.41% now barely ahead of the nation's 0.29%. Florida is still adding jobs at a solid clip, 59,000 over the past year, just not at the pace the state built its reputation on, and we read the rising unemployment rate as confirmation of that slowdown rather than a separate story. Oklahoma and Alabama saw larger rate increases over the same year, but their payroll growth has stayed comfortably ahead of the nation's, which is why we do not read those upticks the same way. Payrolls remain our primary read on a state's underlying performance; the unemployment rate is the check on it, not a competing story.
Policy Watch
The Fed's own rate path, not just Wednesday's vote, is the bigger story for anyone budgeting off the cost of money. The Summary of Economic Projections released alongside the September 16 decision shows the median participant expecting the federal funds rate to end both 2026 and 2027 near 4.1%, with sixteen of eighteen participants penciling in at least one more increase this year and four looking for two. That is a materially more hawkish signal than the Committee's own June projections, and it means the question for our December 9 call is no longer whether the Fed moves again this year but how many times. The local side of Policy Watch slowed from the prior issue's surge. Four jurisdictions took confirmed action on data-center siting in the fourteen days since, Putnam County, Florida approved a one-year moratorium on September 9, Jasper County, South Carolina passed a first reading of a one-year pause the same day, Colleton County, South Carolina adopted a digital-infrastructure overlay district on September 14 that partially repealed its existing moratorium in favor of standing rules, and Prince William County, Virginia's planning commission recommended widening the by-right buffer from homes and schools ahead of a Board of Supervisors vote today. Guilford County, North Carolina scheduled an October 15 hearing on a possible pause rather than voting on one. On the utility side, Virginia's State Corporation Commission added three in-person hearing dates in November for the $67 billion NextEra-Dominion merger review, Duke Energy Florida's rate filing drew objections for redacting its own data-center cost estimates from consumer advocates, and Arkansas legislators questioned Entergy directly over the ratepayer cost of Google's West Memphis campus, with no ruling yet in any of the three. The local side of Policy Watch slowed from the prior issue's surge; the underlying fights did not resolve.
Real Estate Across the South
Housing. Southern list prices have not produced a fresh national report since Realtor.com's August figures, South median list price $380,000, down 2.6% over the year, 21.4% of listings carrying a price cut against 20.4% nationally, and Austin down 9.8% over the year with 27.6% of its listings cut. Freddie Mac's 30-year fixed rate averaged 6.95% for the week of September 18, up from 6.70% right after the August payroll report, and the ten-year Treasury closed near 5.01% the same week. Realtor.com's own seasonal research flags the week of September 27 through October 3 as the best week to buy nationally, and names Austin, Dallas-Fort Worth and Houston specifically as markets in that window, which is a modest tailwind for buyers willing to act against a mortgage rate that moved the wrong way this month.
We also went looking for a chart on year-to-date single-family building permits expecting the South, and Greenville-Spartanburg-Anderson in particular, to rank near the top of the country's fastest-growing metros, and the data did not cooperate with that expectation. The Census data, pulled through FRED for nine major Southern and Sun Belt metros and summed on a not-seasonally-adjusted basis for January through July of both years, the only apples-to-apples way to build a year-to-date total, shows Greenville-Anderson's single-family permits down 1.2 percent for the year through July compared with the same seven months of 2025, and of the nine metros we checked, only Charleston (up 1.6 percent) and Raleigh-Cary (up 1.2 percent) are running ahead of a year ago at all. Charlotte is down 24.2 percent, Myrtle Beach down 12.7 percent, and Nashville down 11.7 percent.
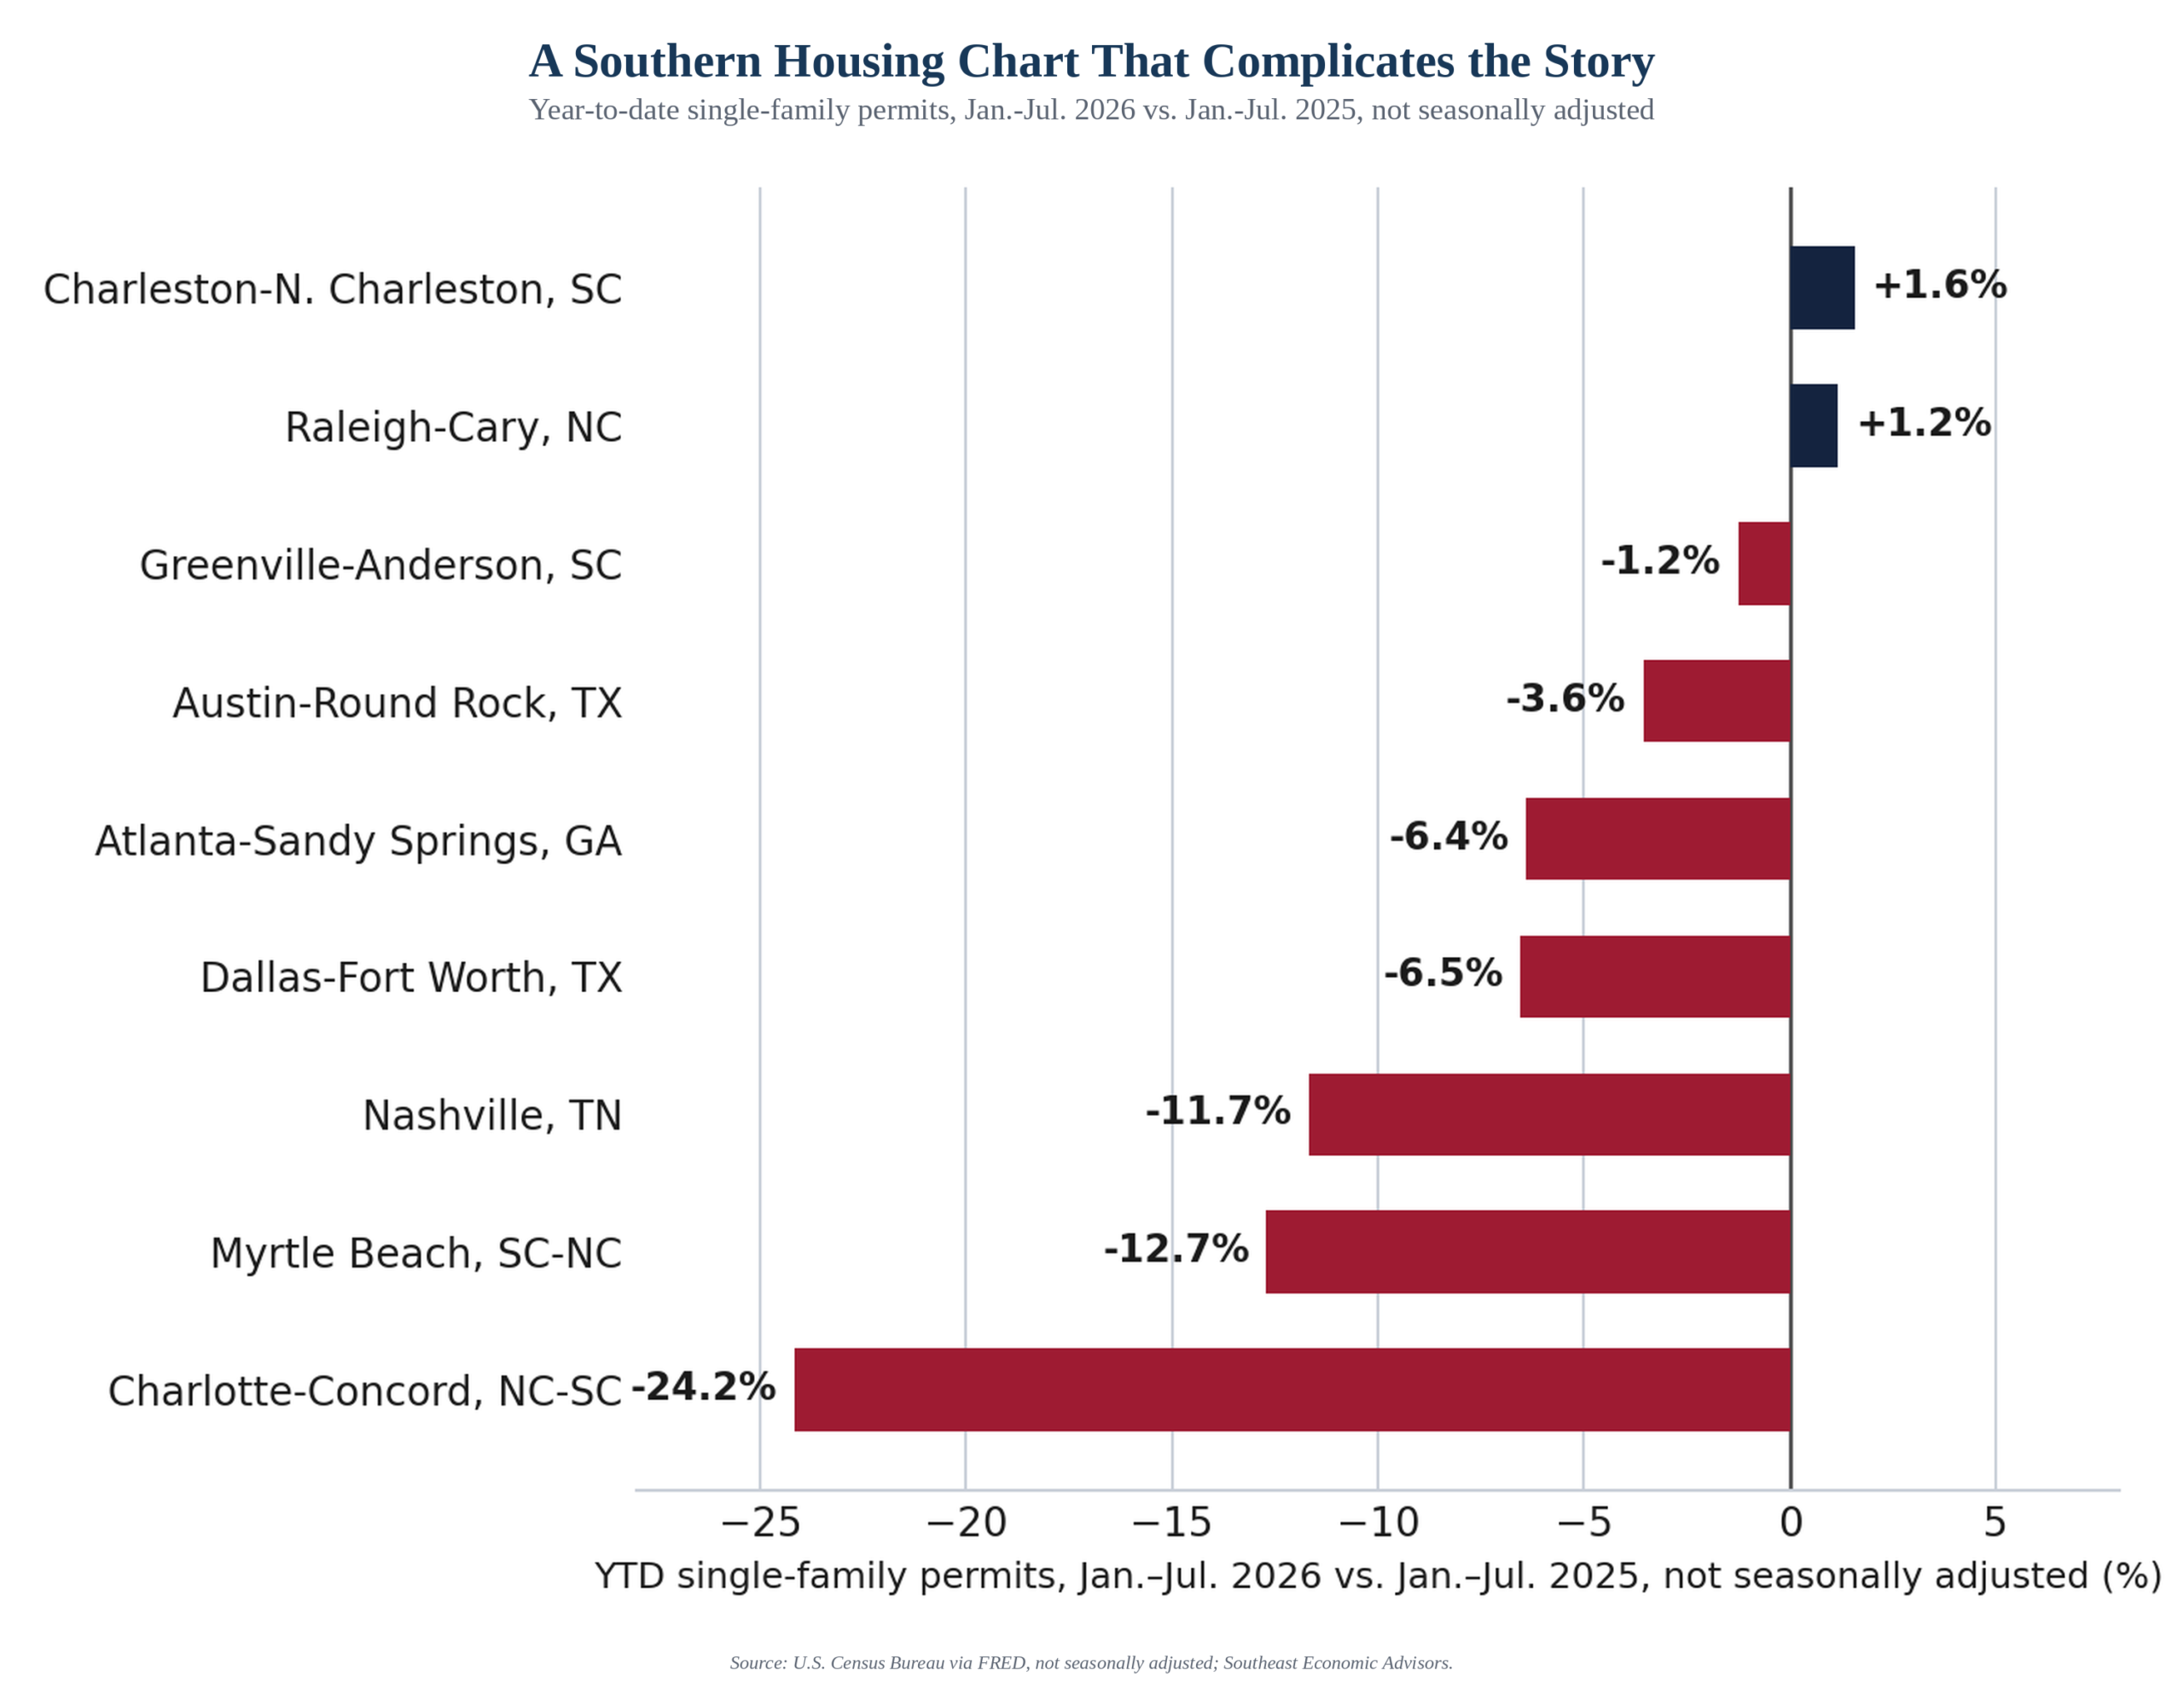
This tracks with the National Association of Home Builders' own national data, which showed single-family permitting in large-metro core counties down 16 percent year over year on a four-quarter moving average in the first quarter, with activity shifting toward small-metro and outlying counties rather than concentrating in big-name growth markets. Greenville-Spartanburg-Anderson is commonly used as shorthand, but the Census Bureau treats Greenville-Anderson and Spartanburg as two separate metro areas, and we could not find a clean single-family permit series for Spartanburg on its own. The honest read of this year's data is that Southern single-family construction is broadly cooling alongside the rest of the country, not accelerating away from it.
Multifamily. Apartment List's national rent report has not yet been refreshed for September; its most recent reading has rents down 0.8% from a year earlier with vacancy at 7.1%, the South and Texas specifically still carrying the deepest declines, San Antonio at negative 5.1% over the year, the sharpest of any large metro, Austin at negative 2.9%, improved from negative 6.8% a year ago, Houston at negative 2.6% and Dallas at negative 1.5%. Apartment List describes the four Texas metros as appearing to have bottomed out, not still falling, which is a different read than a market still deteriorating.
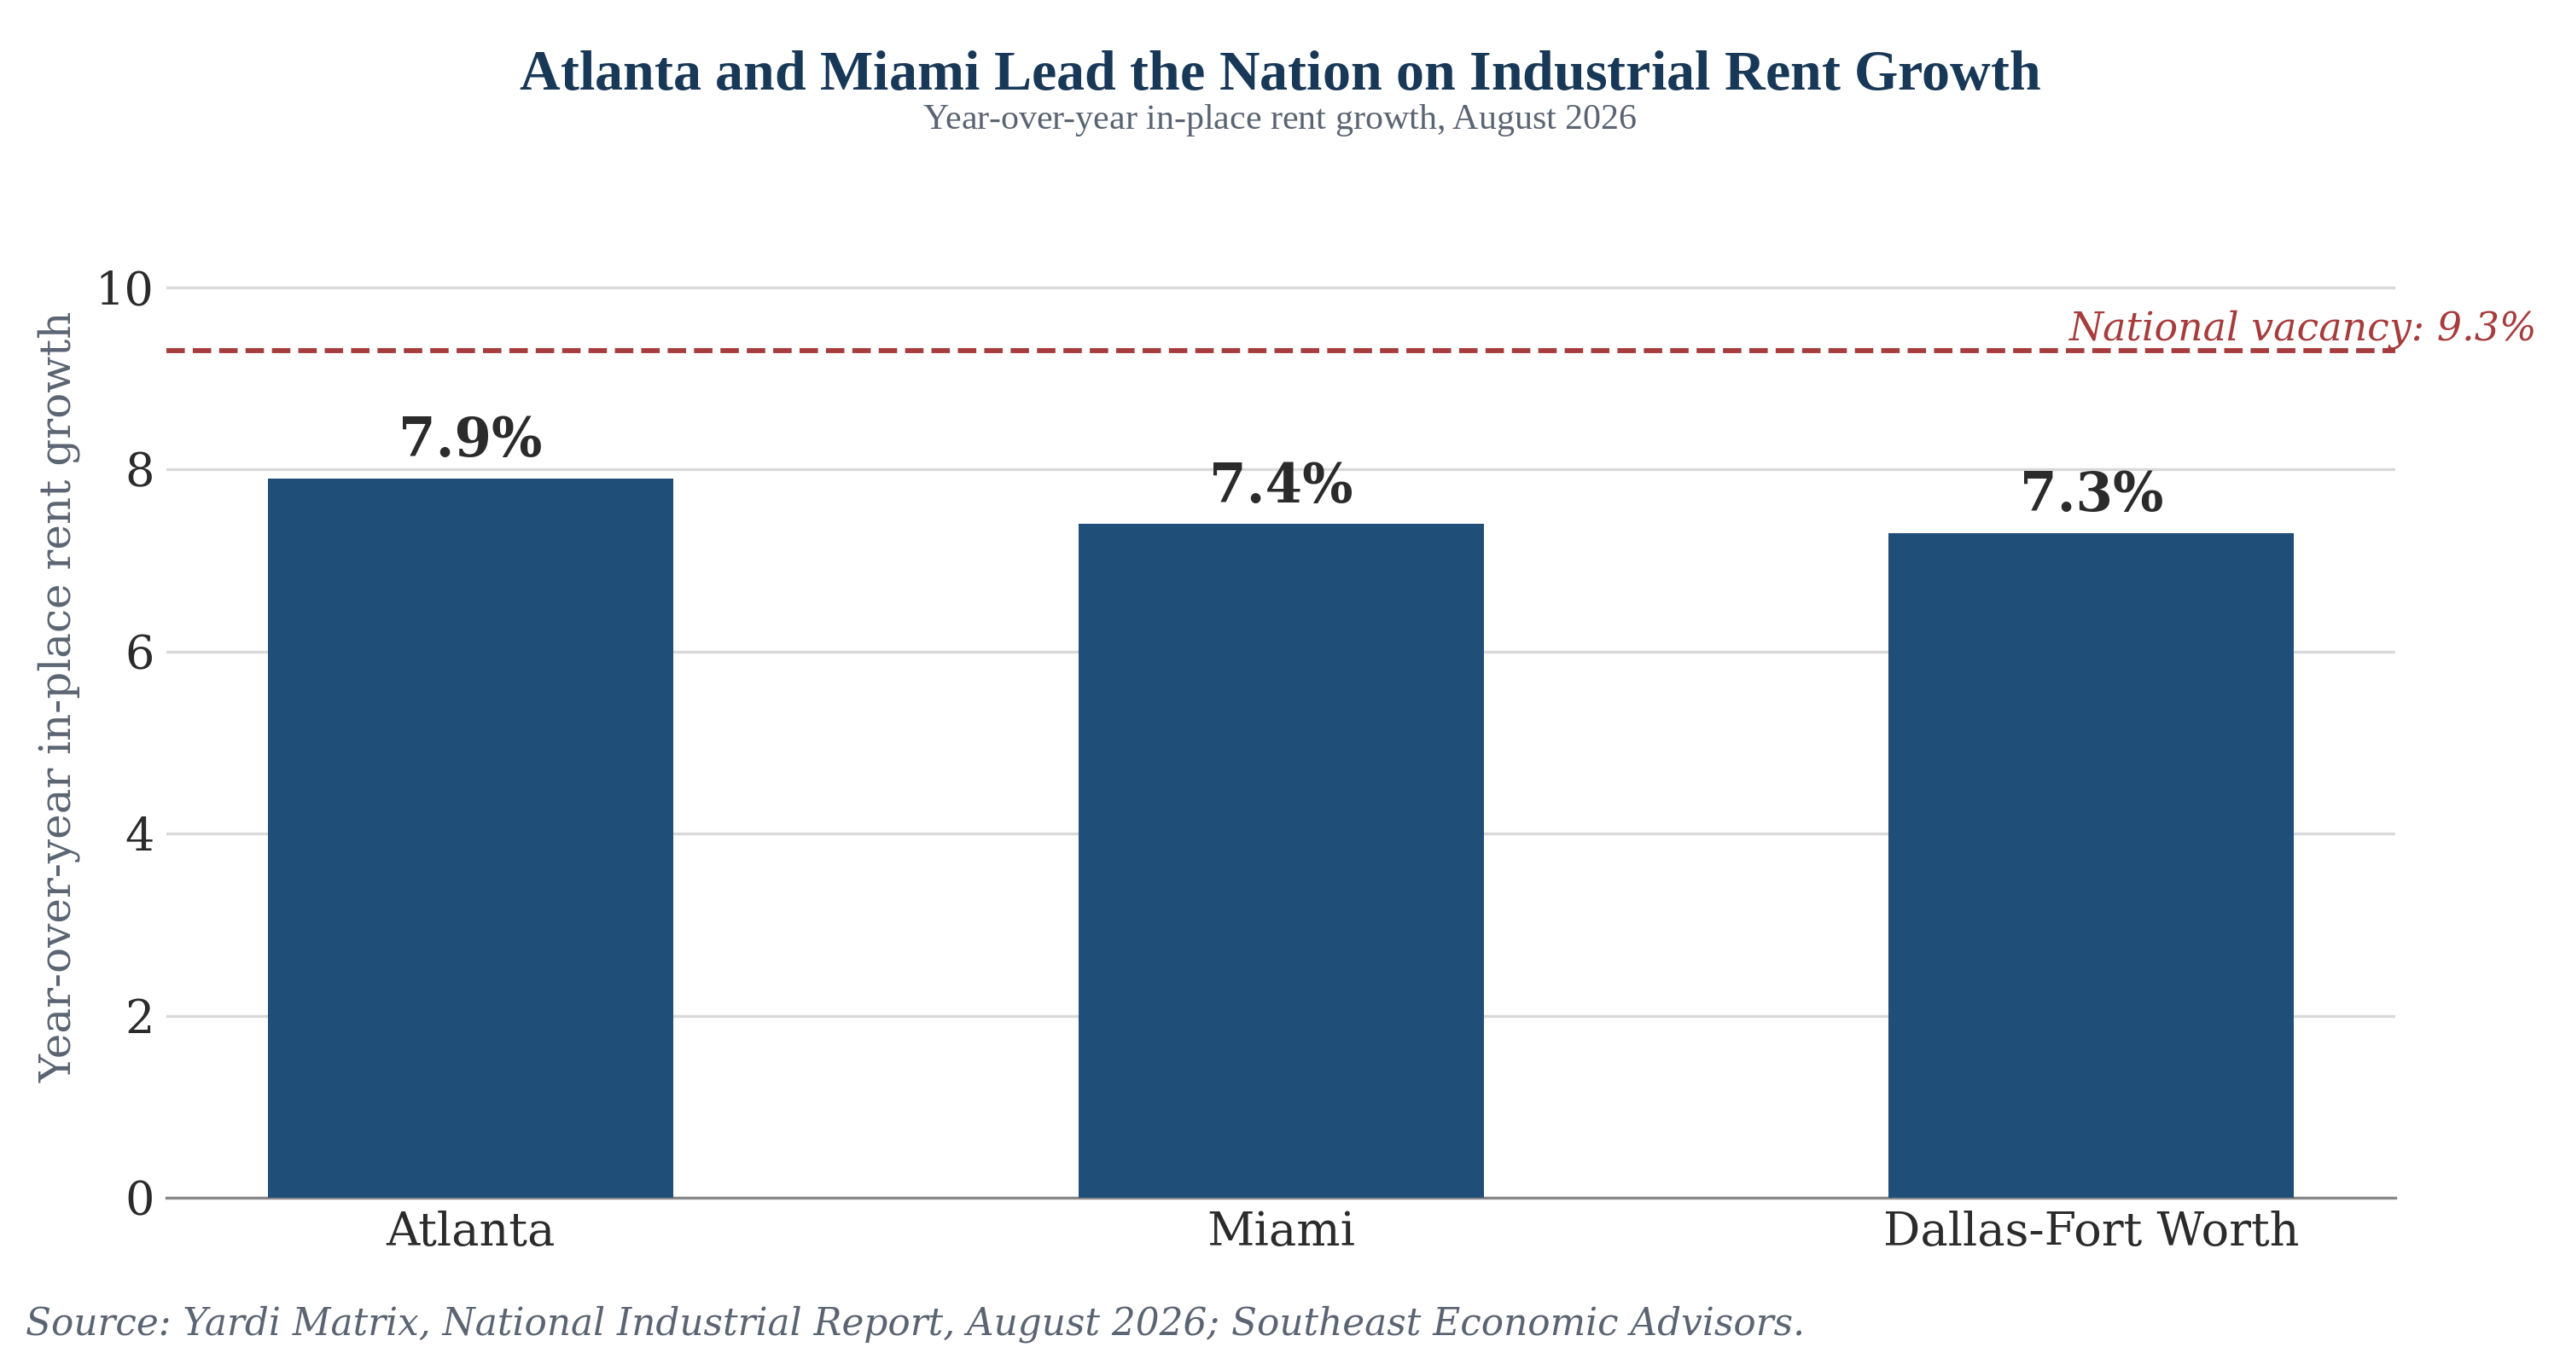
Industrial. Data-center demand is still the clearest driver of industrial rent growth in the region. Yardi Matrix's August report has Atlanta leading the nation at 7.9% annual rent growth, Miami second nationally at 7.4% and Dallas-Fort Worth tied for third at 7.3%, against a national industrial vacancy rate that stabilized at 9.3% even as state-level pushback on data centers continues.
Office and capital markets. Trades are still clearing below prior valuations. A 160,000-square-foot Washington office building at 1775 Pennsylvania Avenue sold for $37.5 million, less than half its $81.1 million prior valuation, a 390,919-square-foot Houston office building traded hands at an undisclosed price, and a group of Maryland-based investors bought an Uptown Dallas tower with plans for up to $10 million in renovations. With the two-year Treasury at a two-year high and the Fed signaling more increases, we look for cap rates on Southern office assets to drift higher rather than stabilize through year-end; a pause in the Fed's own hiking path is what would change that.
Development Wins of the Week
Carolinas. The U.S. Navy's Fleet Readiness Center East will expand at the NC Global TransPark in Kinston, an estimated $140 million in annual economic impact and more than 400 jobs (September 17). In South Carolina, Stöbich Fire Protection Systems will expand its Dorchester County plant with a $2.53 million investment and 33 jobs (September 10). Neither state produced a large new relocation or expansion announcement this window; this is a thin theme this issue and we say so rather than pad it.
Georgia & Florida. Tampa Brass & Aluminum, a defense manufacturer serving the U.S. Air Force and Navy, will expand its Hillsborough County headquarters with a $58 million investment and 50 new jobs (September 14). In Georgia, five local industries in Lowndes County announced a combined $26.2 million investment and 77 new jobs (September 18), smaller in scale than the record fiscal-year total of $35.2 billion that ran in the prior issue. Georgia's August net tax collections rose 3.5% year over year to roughly $2.5 billion, driven by income and sales tax growth (released September 9-11).
Alabama, Mississippi & Louisiana. Hitachi Energy will build a $528 million transformer factory in Copiah County, Mississippi, 654 jobs, its latest U.S. manufacturing commitment (September 15). Louisiana and Alabama had no new announcement with a disclosed dollar figure in this window beyond the state economic development agencies' standing references to their cumulative investment pipelines.
Tennessee & Kentucky. Ford reaffirmed a $1 billion investment in a new paint shop at the Kentucky Truck Plant in Louisville, with groundbreaking expected by year-end (September 10). Tennessee had no announcement in this window with a comparable disclosed investment or job total.
Texas, Oklahoma & Arkansas. No new announcement with a disclosed dollar figure and job count cleared our verification bar in this window; the region's most recent large deals, SpaceX's Texas facility and Bristol Myers Squibb's Houston campus, both predate this issue's window. Oklahoma's August General Revenue Fund collections came in at $604.4 million, 1.3% below the monthly estimate but 0.9% above August 2025, a sharp reversal from July's 15.3% year-over-year decline, though fiscal-year-to-date collections still run 7.2% behind last year's pace (released September 15).
Virginia, Maryland, DC & West Virginia. West Virginia's governor folded a new $12 billion Mason County data-center project from Starwood Digital Ventures into a broader September 3 announcement of $81 billion in new commitments, bringing the state's cumulative total since October to roughly $96 billion, with more than 19,000 projected jobs. In Virginia, Data Machines will expand its Reston headquarters with an $849,000 investment and 75 jobs. Maryland and the District had no qualifying new announcement in this window.
The Week Ahead
Recent Research
Two pieces from our desk this week track different stories from this issue. This week's A View from the Piedmont, "One Hike, Four Fronts," laid out the flip rule's literal hold signal against our own override case for a hike, three days before the Committee delivered one. Our Week Four football preview, Georgia Tech at Stanford, previews Saturday's game between two 1-2 teams meeting for the first time as ACC opponents, and carries a fuller look at the two campuses' own tech-anchored metro areas, Atlanta's Tech Square building boom and the Bay Area's AI-driven office boom, than we could fit in this issue's housing chart above. All of it posts at southeasteconomy.com.
Sources & Notes
Sources: U.S. Bureau of Labor Statistics (State Employment and Unemployment, August 2026, released September 18, 2026; Producer Price Index, August 2026; Employment Situation, Table B-3, August 2026; Monthly Labor Review, "Manufacturing employment in the Southeast," 2021); Federal Reserve Economic Data (state and national total nonfarm payroll employment history); U.S. Department of the Treasury (daily nominal and real par yield curves, September 2026); TIPSWatch (September 17, 2026 10-year TIPS reopening); Federal Reserve Board (Summary of Economic Projections and FOMC statement, September 16, 2026; Beige Book, September 2, 2026); European Central Bank; U.S. Census Bureau (Median Household Income in 2025 Surpassed Previous Highs, September 15, 2026; Income, Poverty, and Health Insurance Coverage in the United States: 2025; American Community Survey 2024 1-year estimates); USDA Economic Research Service (rural income and housing-cost burden); Institute for Supply Management; Freddie Mac (Primary Mortgage Market Survey); Realtor.com (August 2026 Housing Report); Apartment List; Yardi Matrix / Commercial Property Executive; Commercial Real Estate Direct; Virginia Mercury; Tampa Bay Times; Arkansas Advocate; WCJB, WTOC, Live5News, Rhino Times; Oklahoma Farm Report; Georgia Department of Revenue; West Virginia Governor's Office; Kentucky Cabinet for Economic Development; Mississippi Today; North Carolina Governor's Office; Virginia Governor's Office; Hitachi Energy; Tampa Bay Economic Development Council; Georgia Trend Daily (September 18, 2026); Valdosta Daily Times; Vantage Markets and Yahoo Finance (crude oil price coverage, September 21, 2026); Piedmont Crescent Capital (A View from the Piedmont, September 14); U.S. Census Bureau new residential construction data via FRED, not seasonally adjusted; National Association of Home Builders.
Notes: State unemployment rates are seasonally adjusted; year-over-year comparisons for states without a confirmed prior-year figure in this issue's source reporting are omitted rather than estimated. State job-growth rankings use a three-month average, June through August 2026, of year-over-year seasonally adjusted total nonfarm payroll employment; this replaces the single-month unemployment-rate comparison used in the prior issue. The South-Midwest manufacturing mix comparison uses the five largest manufacturing states in each region as a proxy for regional totals, not a formal Census-region aggregate, and is directionally indicative rather than exact. The 2025 Census income and poverty figures are national; the regional breakdown cited is the most recently available, the 2024 American Community Survey 1-year estimate, and is labeled as such throughout. Diffusion indexes measure the breadth of change across respondents, not its magnitude. Hike probabilities and dot-plot figures are as reported at the Federal Reserve's own release. Market levels are intraday or weekly-average figures as cited; Treasury levels moved further after several of the sources here were published, so re-verify before quoting a single level. Year-to-date single-family housing-permit comparisons use not-seasonally-adjusted data summed January through July of each year, the only apples-to-apples basis for a year-to-date total; metro-level Census permit data lags the national release and was not yet available for August at publication. Our definition of the South includes every state that competes in the Southeastern Conference along with the South Atlantic states, extending up to Maryland and West Virginia. Forecasts are those of Southeast Economic Advisors and Piedmont Crescent Capital.